Inflation and Bonds: Why the 2020s Aren’t Like the 2010s

Inflation dynamics aren’t likely to hold the trends that were prevalent in the 2010s, which has implications for bonds and other types of assets.
Why inflation is important and the impact on the bond market
To understand how inflation is relevant to the investor or trader we must first understand what inflation means and its impact on an economy.
Inflation refers to a sustained increase in the prices of goods and services bought by households, such as food items or rent payments. Inflation causes people’s money to be worth less since their money can buy fewer goods and services.
Pushing inflation up could push up interest rates with it. A high enough inflation rate could cause inflation to hit levels where GDP would start to fall instead of growing because the central bank has to raise interest rates to slow the pace of credit creation.
This is traditionally how recessions are caused.
Nominal rate bonds suffer in these cases, especially those with longer duration.
Inflation-linked bonds (ILBs) become more in favor
Inflation-protected bonds are more in favor among traders. They compensate investors for inflation, and this inflation compensation is greater than that of standard (nominal) bonds when price pressures are rising.
These inflation-protected bonds were a product developed by different governments (mostly in the developed world) to help various entities reduce inflation risk.
For example, suppose inflation compensation of inflation-linked United States Treasury bonds is currently 2 percent. If inflation were to rise above 2 percent, the inflation protection would grow faster than standard (nominal) US treasury bonds, which wouldn’t compensate for inflation.
The inflation compensation on inflation-protection bonds is higher than that of the standard (nominal) ones. Therefore, in a rising inflation environment, having some amount of inflation protection through ILBs can be valuable.
Inflationary dynamics and how they’re setting up new trades
Anything that becomes the trend in markets tends to become extrapolated in the forward discounting conditions. In the 2010s, we had low rates and low inflation and that’s what’s continued to be discounted into markets.
However, there’s been a big change in how policymakers are approaching the current economic conditions.
In the 2010s, we had relatively tight fiscal policy. They were running deficits, but only at a few percent of GDP.
Now, deficits are much larger and politicians are less afraid of pushing these deficits higher. In turn, these are accommodated by central bank support, who “print” money to effectively finance them.
These policies in the US have changed balance sheets in the private sector.
No longer is the real economy so dependent on low interest rates, though the financial economy is due to the way the present value of future cash flows is calculated.
Big reversals in paradigms
Throughout history, there’s a pattern that can be observed where one trend gives way to another.
This is a big part of what we found by looking at the past 500 years of financial history.
What economic or asset class trend tends to be hot one decade gives way to another the next.
Big reversals are caused by excesses leading to extrapolation. Investors extrapolate past price behavior into the future, expecting it to continue.
They believe that what has happened will continue to happen or happen again. Reversals happen when the future turns out differently than the past. Busts occur when prices are no longer supported by the underlying fundamentals and vice versa.
Policymakers’ role
Policymakers are also biased toward their recent experiences and are always eventually forced to do something about conditions that are intolerable.
The mistakes they make are more likely to be different than the ones they made in the past. This is because they learned from the most recent events but err when they face conditions they haven’t experienced before in their own lifetimes.
For example, the depression of the early 1930s was long and severe due to the holdout of necessary policy supports.
Policymakers also didn’t initially have a good understanding of the type of problem they were facing because the credit crunch at the end of the 1920s was very different from the previous recessions (often called “panics” back then) that had happened during their lifetimes – e.g., 1893, 1901, 1907, 1920.
The 2010s were a decade characterized by deflation where the overarching goal was to deleverage the economy after the 2008 Great Recession, a classic debt bust in the mold of 1929.
Fiscal policy was overly tight and they found through various episodes throughout the decade that tightening wasn’t yet feasible.
The global economy was already looking different by the end of the 2010s. Put policy responses have been in overdrive in recent years.
The creation of lots of new money and credit to fill in income and balance sheets combined with insufficient output (due to high unemployment) and mangled supply chains has led to structurally higher prices (inflation).
An overshoot of inflation is more likely than an undershoot.
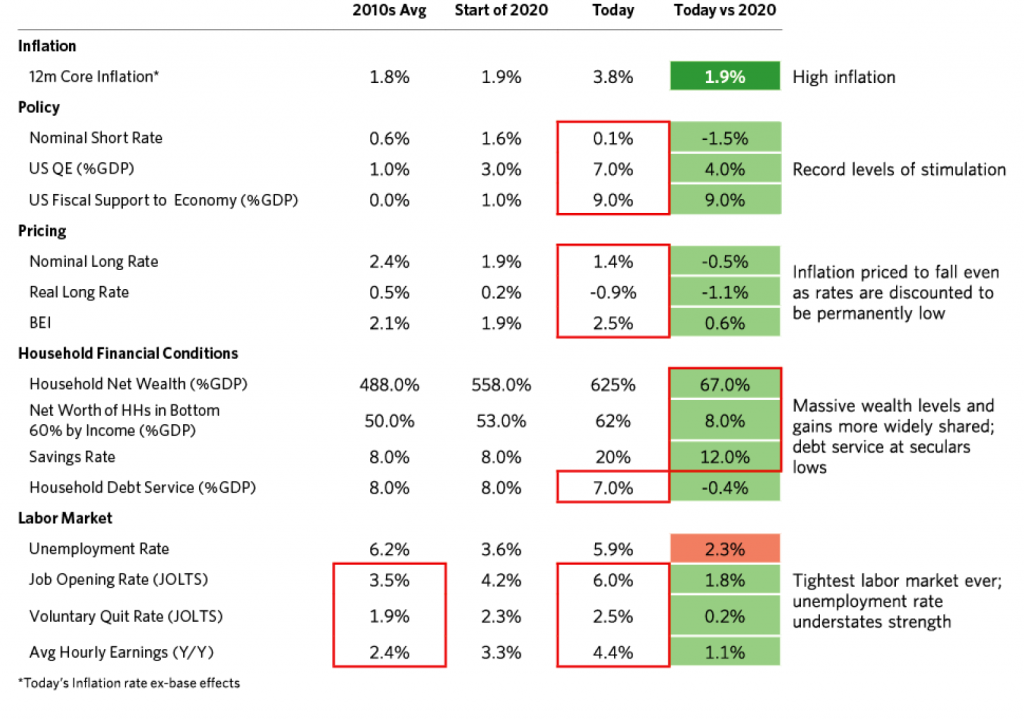
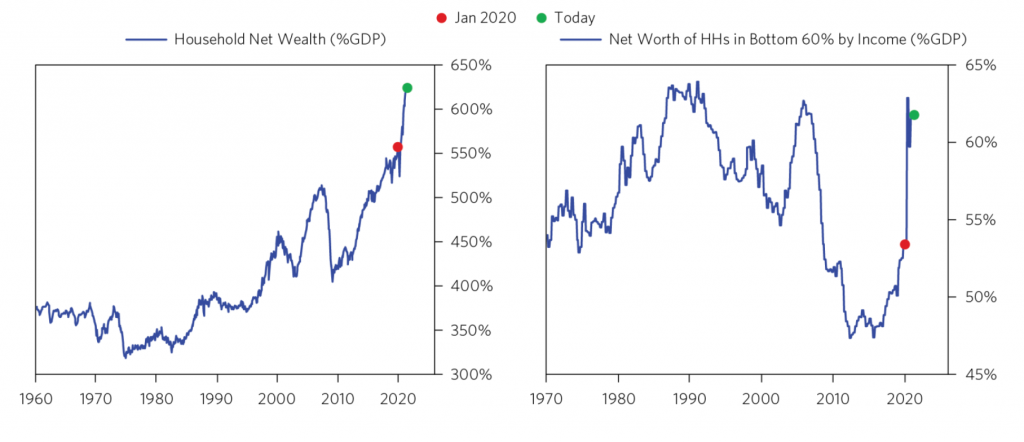
The charts below put into context the shift in the underlying forces governing inflation.
They show:
– a large transformation in household balance sheets (record-high wealth and very low debt service)
– more widely shared prosperity
– the tightest labor market in decades
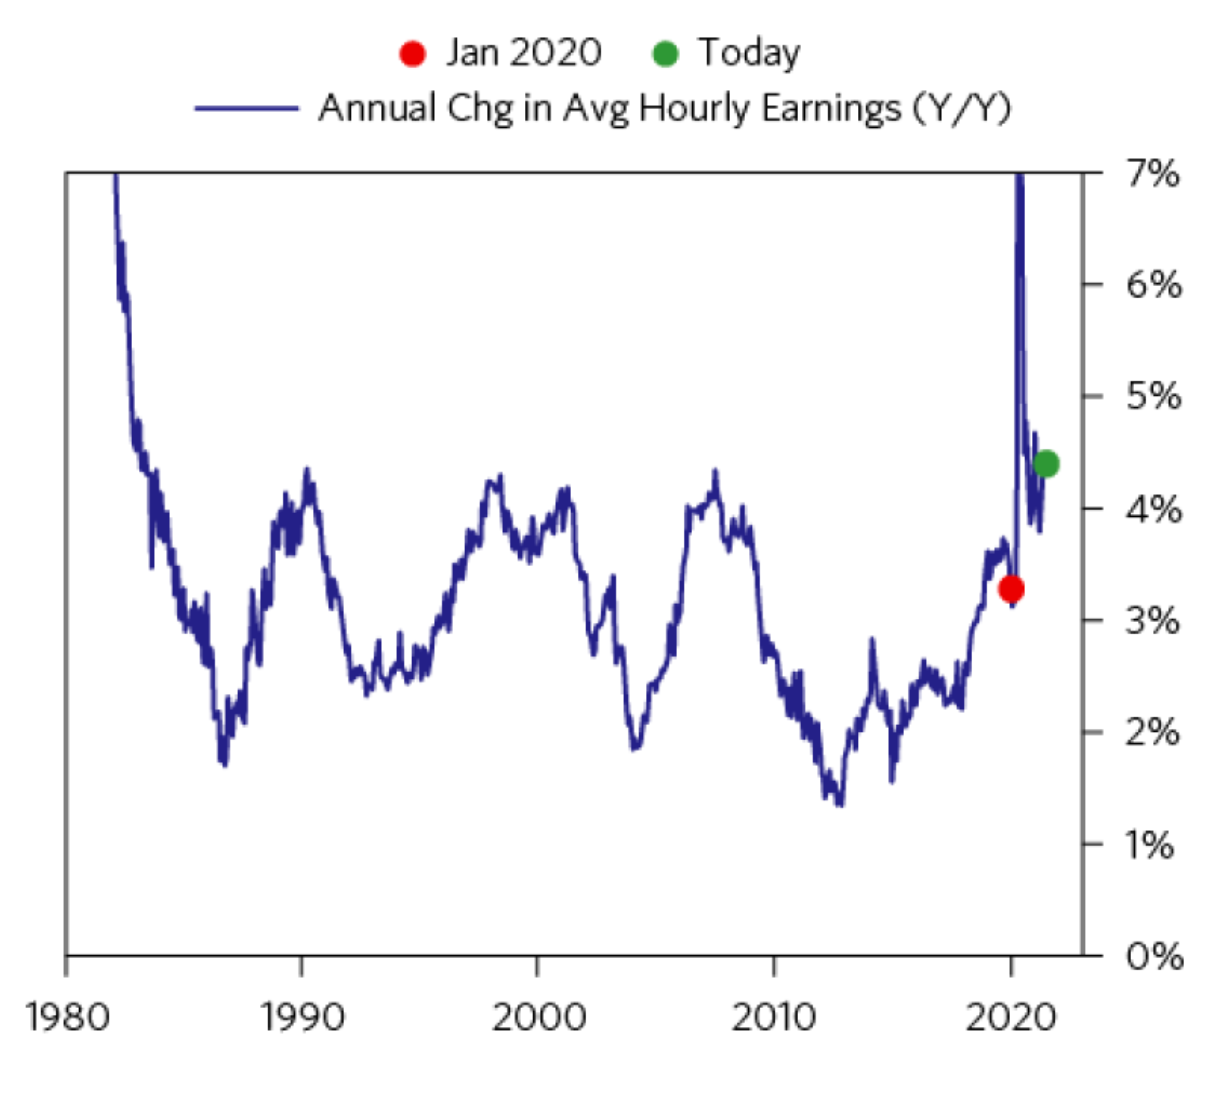
– higher inflation, and
– the easiest monetary and fiscal policy ever, and into a booming economy
Despite this, interest rate markets are lagging the changes that are ongoing, and setting up some enticing trades in the rates and bond markets.
Inflation dynamics: Now vs. pre-2020
Interest rate markets discount a return to normalization
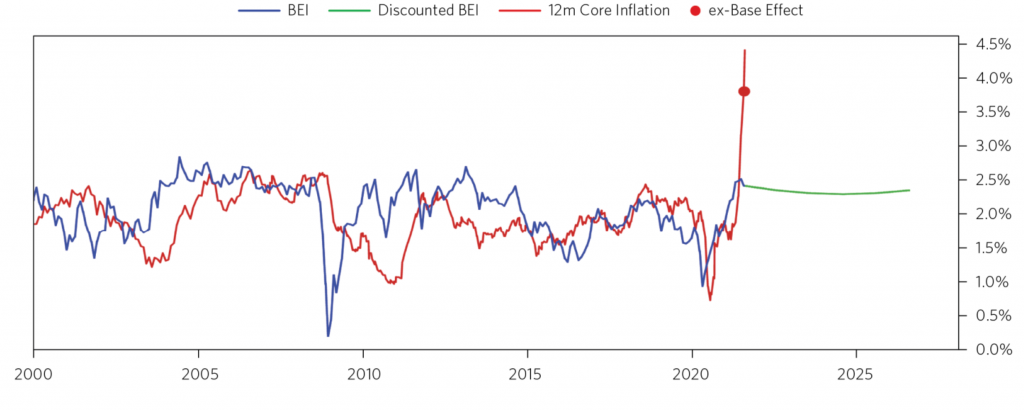
Even though conditions are changing, interest rate markets are looking at higher inflation as temporary and pricing in little chance of a sustained overshoot.
Core inflation is at the highest level it’s been in decades. Yet the breakeven inflation rate derived from the yield on TIPS* (a form of inflation-linked bonds) relative to nominal rate bonds remains well below inflation rates and at levels seen over the last decade or so.
*With inflation linked bonds, the coupon adjusts with inflation as measured by the consumer price index (CPI) or some other standard.
Breakeven inflation vs. inflation
Likewise, long-term interest rates aren’t discounted to return to pre-2020 levels for years.
Nominal long bond rate and the discounted path forward
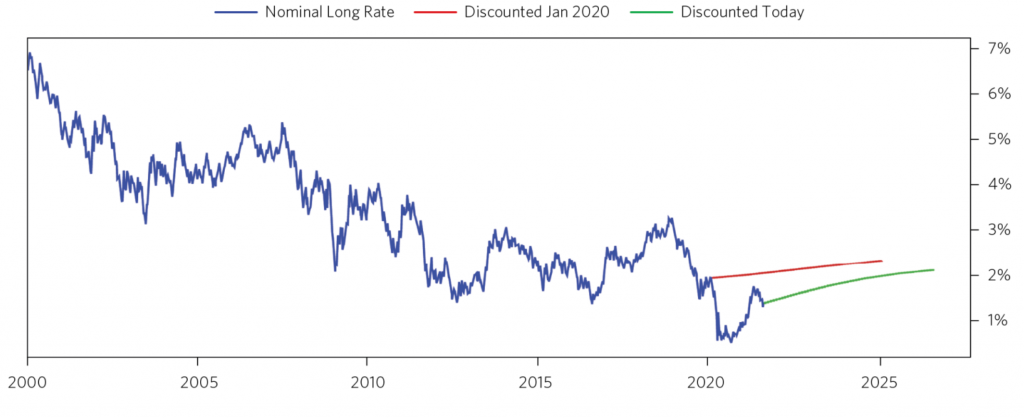
All in all, rate markets are pricing in a return to normal conditions at the same time things are changing under the hood.
Moreover, rising interest rates are a material risk to asset prices. When interest rates are already low, the duration of financial assets lengthens, making them more sensitive to where interest rates go.
Accordingly, a short position in US Treasury bonds has an appealing risk/reward profile and can also hedge out the most material risk in financial markets.
This risk is policymakers facing constraints by inflation and currency risk. Inflation issues come first; currency issues come later.
In light of this, it’s likely central banks will begin to accept higher inflation rates than they have historically.
This is because the trade-offs of lower asset prices and lower economic growth are so unappealing relative to simply letting inflation run from 2 percent to 3-4 percent, for example.
Letting nominal GDP – i.e., real GDP plus inflation – run higher than normal also makes it easier to service debt.
At the same time, inflation would risk pushing up interest rates, which would lead to a slowing of economic activity and cause other difficulties for policymakers.
Monetary and fiscal policy is very stimulative
As a result of the shift to the new paradigm of:
- near-zero interest rates
- asset buying (QE) and
- coordinated monetary and fiscal policy…
…the US economy faces very stimulative policy relative to conditions.
Short-term interest rates are very close to zero and priced to not change much for years. Long-term interest rates are also low, and are especially low (negative) in real terms.
The nominal short rate (on the left below) and the nominal and real long rates (on the right) are all very low.
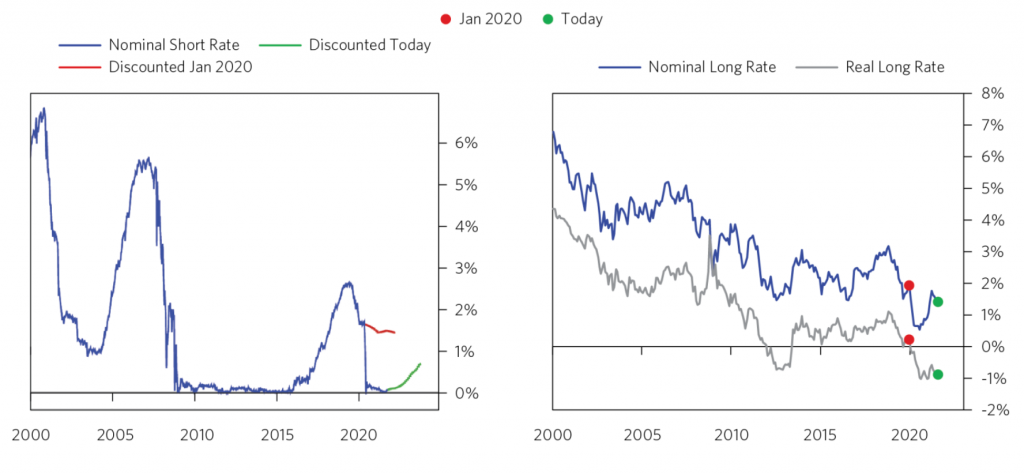
The big risk for asset prices is a rise in these rates, which could hit income-generating assets like stocks, credit, and real estate.
And we also know that these rates aren’t likely going to be able to be pushed much lower than where they currently are. This gives a short trade of longer-duration bonds a relatively attractive risk/reward profile.
The new policy paradigm is likely here to stay
The US entering into an era where monetary and fiscal policy are more heavily linked is likely to stay.
The economy has been running large deficits.
This is funded by central bank asset buying. In other words, the central bank “prints” money and buys the debt due to a lack of private sector and free-market demand for it.
Going forward, each new downturn in the economy is likely to be met with additional rounds of stimulus that are larger than the previous ones.
The attitude toward fiscal stimulation has evolved. For example, the US federal government passing $4 trillion spending bills – around 20 percent of GDP in one go – were formerly unheard of but are now normal.
And it’s not the spending per se, but the return on this spending that matters. However, governments don’t have a great historical track record of getting good ROI on their spending.
Fiscal stimulus can be crucial for bringing along important parts of an economy. And fiscal stimulation can have positive effects on economic growth even if fiscal deficits are initially high.
But, if overdone, it will lead to high levels of public debt and fiscal deficits. Higher debt levels increase interest rates on public borrowing and reduce fiscal space for future governments. Alternatively, if the government wants to control interest rates, it will need to devalue its currency, which will create inflation, holding all else equal.
Policy support has helped household balance sheets in a broad-based way
The policy shift is having a big impact on households’ ability to spend and consume as well as their ability to tolerate higher inflation and interest rates.
This marks a departure from the 2010s – more of a “pure QE era” – where the money from central bank asset purchases accrued heavily to wealthy asset holders.
When the central bank bought bonds, the holders of these bonds (investors) took this money and put it into other investments. So it went into corporate credit, stocks, and things of that nature. This led to inflation in the financial economy.
But asset holders are less marginally likely to put the money to work in the real economy. So QE by itself doesn’t do a good job of converting investment gains into spending.
It may have some trickle-down effect, such as lowering corporate borrowing rates, which makes it easier to hire new workers, make other types of productive capital investments, and so on.
But the new era of policy – where the focus is more heavily on fiscal stimulus – means that the gains are more likely to accrue to a broader base of the population.
This means more of the money is likely to go into spending and therefore more price pressures in the real economy. This is opposed to inflation in the financial economy because that’s where the money goes in a more pure QE world.
The chart on the right below shows that the net worth of households in the bottom 60 percent is increasing at the quickest pace relative to incomes since the early 1990s:
High savings rates
Savings rates are often viewed as a counter-cyclical indicator. Namely, savings rates go up during the “lean” years and then drop off as people return to normal consumption habits post-recovery.
This can be seen in US savings rates over recent decades. Savings rates have averaged about 7 percent since 1960.
The labor market is very tight
A rush of spending could hit the real economy at the same time labor markets are already very tight. This could worsen the inflationary challenge for policymakers.
Despite unemployment being sub-6 percent, job openings are at multi-decade highs. The same is true for the percentage of workers who are voluntarily quitting their jobs.
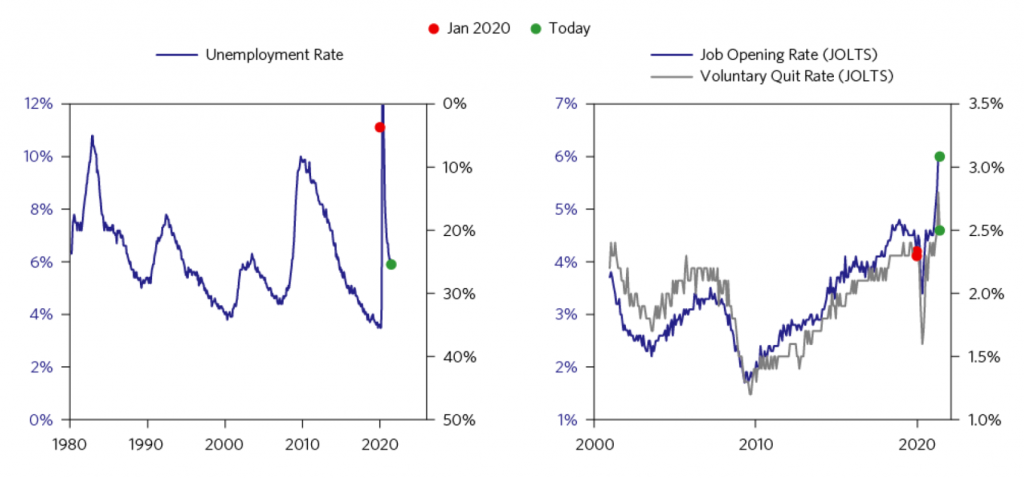
A labor shortage with rising wages presents additional inflation risks.
Commodities already reflect growing inflationary pressures
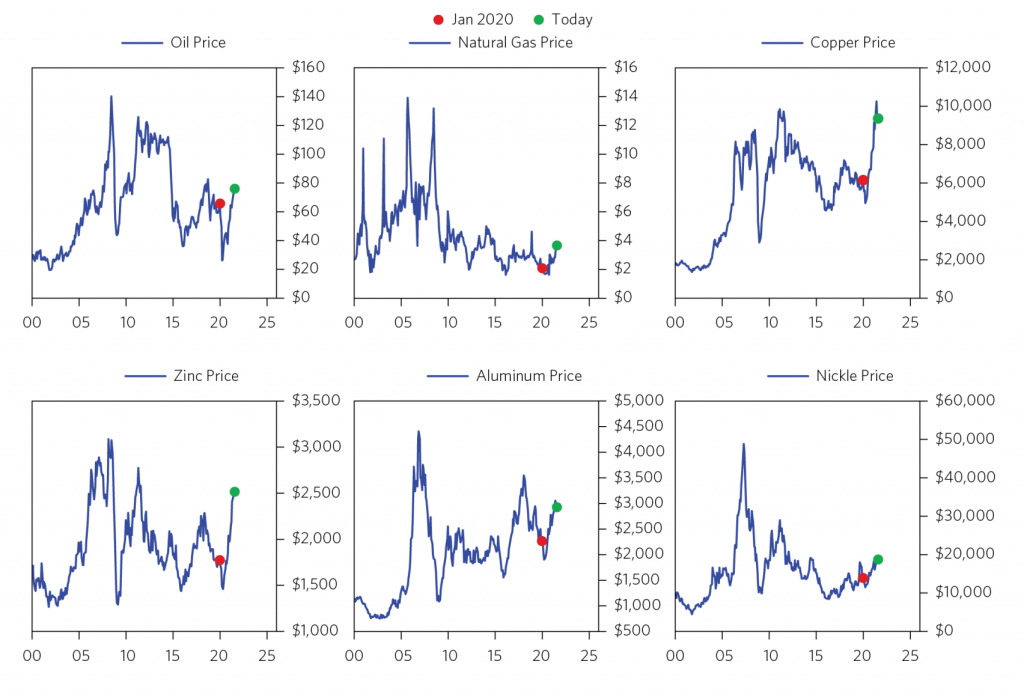
The rally across commodity markets adds to inflation risks. In the 2010s, a broad commodity index was basically flat.
The financial news of the 2010s was dominated by stocks. Now commodities have been a much bigger story, from oil’s rally to natural gas’ rally – a function of demand and underinvestment in supply – to lumber and other commodities.
The breadth of the commodity rally also emphasizes the fundamental nature of the inflationary pressures. And these have various feed-ins into consumer products.
Many commodities are not as high as they were during the peak boom years following China’s entrance into the WTO, but commodities are an asset class that is much more in favor relative to bonds.
Inflation will challenge bonds and potentially stocks as well
The US is taking fiscal and monetary policies to lengths that haven’t been attempted in modern times.
This has trade-offs.
The national debt and other liabilities related to pensions, healthcare, and unfunded obligations add up to over $300 trillion total.
They’re not going to be able to get all the money from taxes or tax increases no matter how they engineer tax policy.
This means they have to print a lot of money to meet those obligations in nominal terms.
This is not free. Either you get the pressure through:
- higher bond yields = lower bonds prices or
- a weaker currency
In the short-term, you might get the pain in yields.
This can cause a sell-off in both bonds and stocks. Higher yields cause the discounted present value of cash flows to decrease.
That also feeds into the economy, with lower collateral values, lower creditworthiness, lower incomes, and so on.
But after a point, it can get to a point where it’s too painful so it’ll transfer into the currency as a longer-term risk. Policymakers create money and buy bonds to control yields.
Devaluing the currency is more discreet because it’s not clear who’s paying the price (unlike raising taxes or cutting spending). It’s a type of under-the-radar tax.
And it’s less painful than rising credit costs.
From a trader’s perspective, you know you can get either rising yields or a weaker currency. But you don’t necessarily know which one, or what the extent of the move will be.
And the timing is difficult as well.
This means from a portfolio construction perspective, there is no one answer. You have to have a diversified answer.
That means you can have both a short bonds and short dollar trade if you have a long-term perspective.
Expressing a short currency trade can be relative to some other currency or it can be relative to something like owning another store of value.
This can be gold, other types of precious metals, certain stocks, or other commodities.
In other words, a short currency trade doesn’t necessarily have to be expressed as shorting the currency versus another national currency. This is especially true when those other currencies have similar fundamental issues (e.g., USD relative to EUR, JPY, GBP).
When you create a lot of money and credit, it devalues it. In the process, it causes other types of financial assets to go up.
Arbitrage effects to take advantage of
The big arbitrage effect in the markets relates to the spread between nominal GDP and interest rates.
Look at what policymakers are giving you.
They’re giving you very low interest rates but relatively high nominal GDP (real GDP + inflation).
That means you probably want to own nominal GDP (various types of cash flows) and not own interest rates (cash and bonds).
In fact, when the main risk to this story is higher interest rates and higher bond yields to fight inflation, you probably want to be short rates and/or bonds in case the spread between the two starts to close.
How do you own nominal GDP?
Commodities can be a piece of that. But of course, owning certain types of stocks and businesses is helpful whose cash flows closely mirror nominal GDP and spending patterns.
This means entities with an income generation focus – commonly individual investors approaching retirement, pensions, endowments, foundations, and similar entities – are going to look for safer types of stocks.
Fixed income yields are so low in nominal terms and mostly negative in real terms so they’re forced to go more heavily into the equity markets.
Consumer staples
Certain stocks that involve selling products people need to physically live (e.g., consumer staples) can be good stores of value. They won’t be the most exciting investments over time, but as a whole they’ll probably be more reliable than the average stock as a whole.
These companies don’t rely on interest rate cuts to help offset a loss in income. With interest rates so low, you can’t rely on rate cuts to help you, so it’s important to keep this in mind.
The companies that provide these services will change over time. But a diversified mix of consumer staples is likely to do quite well in reliably growing their earnings.
Consumer staples are less affected by economic cycles than other types of investments because they sell necessities rather than luxuries. Their products (e.g., food, the everyday basics, toothpaste, basic medicine) will always be in demand. A good consumer staple stock or business would be one whose consumer product or service does not see changes in consumer demand based on economic conditions regardless of how wealthy consumers are at any particular time.
People may cut back on their spending levels on certain items, but they will still need basic necessities like food and household products even if they’re tightening their budgets.
So the lack of cyclicality means their sales performance is not typically correlated with the economy’s health.
This is opposed to companies that are sensitive to interest rates or highly interconnected with how the economy performs, like a manufacturing business.
Their stability makes consumer staples well suited to long-term strategies.
For example, if the economy goes into recession and consumer confidence declines, restaurant sales suffer because people choose to eat in instead of dining out. Airlines will also suffer. However, something like Proctor & Gamble does not typically experience a drop in sales when the economy performs poorly (or when it’s booming).
This makes consumer staple stock an attractive proposition for many investors looking to balance out their portfolios with stable non-cyclical stocks.
Other stocks in consumer staple industries include consumer food manufacturers (e.g., Coca-Cola), consumer tobacco manufacturers (e.g., Phillip Morris International), and consumer beverage (e.g., PepsiCo).
Traders and investors can feel pretty good about the idea that these companies or companies similar to them, on aggregate, are very likely to see their earnings increase fairly reliably at about the rate of nominal GDP growth.
Utilities and real estate
Some might also consider utilities and real estate to be in the same category. They provide basic services (e.g., water, electricity, heating, shelter) and provide basic needs.
And while everybody needs a place to live and work, real estate is a mixed bag and more of a specialized market as more money is going into data centers and warehouses and less is going into malls and commercial real estate.
The residential real estate market is unique in that real estate provides some type of real value to the owner, but is not liquid. The primary real value comes from the expected rental revenue plus the depreciation tax shield provided by the property over its depreciable life.
And with real estate prices so tied to construction costs and credit availability and its cost, real estate supply follows real interest rates more closely than it does real incomes.
But there are two basic tailwinds that have helped US residential real estate investors:
1) Real interest rates have been at historical lows and real incomes (and real GDP and job growth) haven’t grown as fast as real home prices;
2) There haven’t been any new housing units built in the United States to meet the increased demands of higher real incomes and low real interest rates.
REITs
Real Estate Investment Trusts (REITs) are a viable alternative to individual real estate investments.
REITs resemble mutual funds and function like diversified real estate portfolios – income-producing real-estate such as shopping centers, office buildings, apartments, and hotels.
This can mitigate risk because not all real estate projects will be affected by market downturns at the same time. REITs provide a way to invest in real estate without having to pay rent or purchase property. (Not all companies that own multiple properties qualify as REITs, however.)
The main advantage of REITs is their tax treatment, which qualifies them as pass-through entities in which all net income or loss flows through the stockholders’ personal returns.
As a result, real estate investment trusts do not pay corporate taxes. Instead, they pass on all or most of their real estate income to shareholders. REIT dividends are treated as real estate income for tax purposes and therefore they can reduce their taxable income by distributing their earnings to shareholders in the form of dividends.
Investors are able to buy shares on the stock exchange just as they would any publicly traded company. The price of these shares changes throughout the day depending on supply and demand, just like regular stocks do.
Additionally, just as with other stocks, REIT prices vary with earnings expectations.
Many REITS will pay out 90 percent or more of profits as dividends, giving them attractive dividend yields in exchange for lower capital gains and growth potential than other common investments like regular stocks.
As interest rates drop, REITs will tend to become more attractive investments because the debt financing costs are lower. The dividend yields of REITs increase as their prices decline.
So they may look more attractive relative to other investments like bonds which provide less income through coupon payments.
Even though REITs are packaged in a different way than traditional stocks, it is important to remember that they do contain significant risk.
If real estate prices decline, real estate securities will likely decrease in value as well. This risk can be mitigated by spreading investments across real estate sectors and types, as well as, of course, having investments outside real estate entirely.