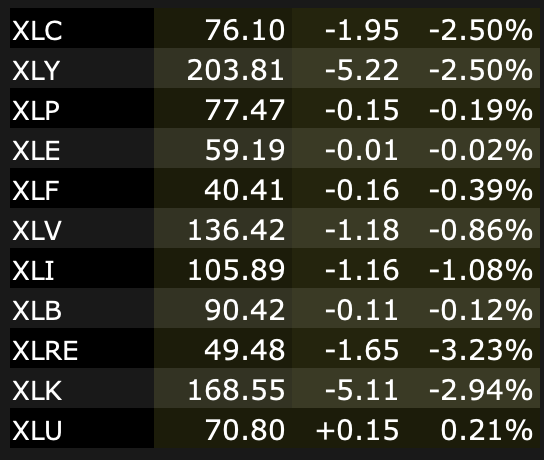
The Complete Guide to Trading and Investing in Utility Stocks


Adding utility stocks to a portfolio can enable traders and investors to add a lower-risk type of equities to their portfolio that can generate income by paying dividends.
Utilities are a type of essential. When we covered consumer staples stocks, we talked about their value in terms of the fact that people will always need what they have to sell.
Everybody needs electricity, running water, heat, and so on.
This is opposed to things like consumer discretionary and other firms that sell things that are easy for consumers and companies to not buy when there’s a downturn in the economy. This includes things like luxuries, some entertainment options (going to a movie), and vehicles and forms of heavy equipment.
A person doesn’t necessarily have to go to the movie theatre or shop at Louis Vuitton, but they (or whoever’s responsible) do need to pay their electric, water, and gas bills.
This fairly consistent revenue and cash flow makes them pretty stable investments. There are, however, things like interest rates to pay attention to, that can cause these stocks to lose value.
At the same time, the lower-risk nature of utility stocks means you’re not likely to see big gains. Capital appreciation will be limited because they don’t grow much and any excess cash is mostly used for maintenance capital expenditures and paid back out to shareholders.
Utility stocks and the benefit of regulation
Utility stocks benefit from being part of a regulated industry. They’re essential services so governments have a hand in them.
This also means there are not a lot of competitors.
As a fairly staid industry, the revenues and earnings of these companies are fairly predictable. So their dividends tend to be pretty consistent as well.
The volatility of utility stocks relative to other industries is low because of this stability. It tends to be on par with or even lower than that of the broader market.
It’s also the least correlated sector, as can be shown in the table below, which shows correlation coefficients among the broader market (SPY) and various sectors, annualized returns (CAGR), and daily, monthly, and annual standard deviations.
| Name | Ticker | SPY | XLU | XLC | XLY | XLP | XLE | XLF | XLV | XLI | XLB | XLRE | XLK | CAGR | Daily Stdev | Monthly Stdev | Annual Stdev |
|---|---|---|---|---|---|---|---|---|---|---|---|---|---|---|---|---|---|
| S&P 500 | SPY | 1.00 | 0.52 | 0.90 | 0.94 | 0.80 | 0.78 | 0.89 | 0.82 | 0.93 | 0.91 | 0.79 | 0.92 | 19.42% | 1.34% | 5.12% | 17.72% |
| Utilities | XLU | 0.52 | 1.00 | 0.40 | 0.46 | 0.71 | 0.21 | 0.44 | 0.51 | 0.50 | 0.53 | 0.70 | 0.35 | 13.22% | 1.49% | 4.54% | 15.73% |
| Commun | XLC | 0.90 | 0.40 | 1.00 | 0.83 | 0.69 | 0.73 | 0.84 | 0.66 | 0.82 | 0.79 | 0.70 | 0.83 | 14.71% | 1.47% | 5.57% | 19.30% |
| Cons Disc | XLY | 0.94 | 0.46 | 0.83 | 1.00 | 0.68 | 0.73 | 0.77 | 0.72 | 0.82 | 0.84 | 0.73 | 0.89 | 20.88% | 1.46% | 6.12% | 21.20% |
| Cons Stap | XLP | 0.80 | 0.71 | 0.69 | 0.68 | 1.00 | 0.52 | 0.70 | 0.75 | 0.77 | 0.78 | 0.77 | 0.68 | 15.32% | 1.12% | 4.10% | 14.21% |
| Energy | XLE | 0.78 | 0.21 | 0.73 | 0.73 | 0.52 | 1.00 | 0.84 | 0.57 | 0.76 | 0.74 | 0.61 | 0.63 | -3.36% | 2.42% | 11.25% | 38.97% |
| Financial | XLF | 0.89 | 0.44 | 0.84 | 0.77 | 0.70 | 0.84 | 1.00 | 0.65 | 0.91 | 0.86 | 0.70 | 0.71 | 14.02% | 1.79% | 6.77% | 23.46% |
| Health Care | XLV | 0.82 | 0.51 | 0.66 | 0.72 | 0.75 | 0.57 | 0.65 | 1.00 | 0.73 | 0.77 | 0.71 | 0.68 | 18.25% | 1.26% | 4.73% | 16.37% |
| Industrial | XLI | 0.93 | 0.50 | 0.82 | 0.82 | 0.77 | 0.76 | 0.91 | 0.73 | 1.00 | 0.91 | 0.73 | 0.78 | 13.89% | 1.60% | 6.60% | 22.88% |
| Materials | XLB | 0.91 | 0.53 | 0.79 | 0.84 | 0.78 | 0.74 | 0.86 | 0.77 | 0.91 | 1.00 | 0.72 | 0.76 | 15.92% | 1.57% | 6.10% | 21.12% |
| Real Estate | XLRE | 0.79 | 0.70 | 0.70 | 0.73 | 0.77 | 0.61 | 0.70 | 0.71 | 0.73 | 0.72 | 1.00 | 0.63 | 17.96% | 1.55% | 4.91% | 17.00% |
| Tech | XLK | 0.92 | 0.35 | 0.83 | 0.89 | 0.68 | 0.63 | 0.71 | 0.68 | 0.78 | 0.76 | 0.63 | 1.00 | 31.48% | 1.73% | 5.80% | 20.11% |
Portfolio Returns
Utility stocks can be a good addition to most portfolios as a diversifier because of the environment they operate in.
They also tend to have lower drawdowns than the broader market because of the steady income they provide.
Below we can find portfolio returns from 1999 forward. (The most popular utilities ETF, XLU, came about in December 1998, so 1999 is the first full year.)
| Ticker | Initial Bal | Final Bal | CAGR | Stdev | Best Yr | Worst Yr | Max Draw | Sharpe | Sortino | Correl |
|---|---|---|---|---|---|---|---|---|---|---|
| SPY | $10k | $58,496 | 7.8% | 14.9% | 32.3% | -36.8% | -50.8% | 0.48 | 0.70 | 0.99 |
| XLU | $10k | $53,193 | 7.5% | 14.9% | 28.7% | -28.9% | -43.5% | 0.45 | 0.64 | 0.40 |
- Initial Bal = initial balance
- Final Bal = final balance
- CAGR = annualized return
- Stdev = standard deviation in returns (annual)
- Max Draw = maximum drawdown
- Sharpe = Sharpe ratio
- Sortino = Sortino ratio
- Correl = correlation to US stock market
What Are Utility Stocks?
So what exactly do they all include?
The utility industry includes the entire energy and essential utility services value chain.
This goes all the way from initial power generation itself to the electric outlet in a home, building, or business serving the power, including all distribution and transmission networks.
Electricity is the most common type of utility. But it also covers water, waste service, and natural gas distribution.
Increasingly, there are additional ways to produce electricity via renewable energy sources. Wind and solar are most common in this growing sub-niche of the utilities space.
Renewables are not as popular in terms of investments given their economic viability is still coming along.
Utilities tend to correlate to some extent with bonds. They can often diverge from other types of equities (XLU is utilities).
And most traders and investors tend to have a lot of equity risk. This is natural because stocks tend to return the most and are the easiest thing to invest in.
But concentration in anything leads to periods of painful drawdowns.
This increases the need for downside protection.
Utilities are a way to have some form of protection without explicitly paying for it (i.e., by buying options) because they come as a form of diversification.
By owning something that everyone needs, the consistent cash flow of utilities can serve as a buffer so that the overall portfolio doesn’t go down too much in a market correction or bear market.
This prevents periods where traders end up having to sell when prices go down because they get margin calls or need the cash, and buy at high prices when they’re better off financially.
This dash for cash when markets fall and comfort buying in when markets are high and relatively tranquil can severely limit long-term returns.
How utilities actually make money
Most US utilities are regulated monopolies. A state public utility commission sets the rates a company can charge its customers, so the way these businesses earn a profit looks different from a normal company.
Here’s the core idea. A utility earns a regulated return on the capital it puts into poles, wires, pipes, power plants, substations, and meters. That pile of invested capital is called the rate base.
In a proceeding known as a rate case, the commission approves an allowed return on equity, usually somewhere around 9 to 10.5 percent, that the utility can earn on that rate base.
So a utility grows its earnings mainly by growing its rate base. When it builds new transmission lines or replaces aging gas pipes, with the regulator’s approval, it adds to the capital it earns a return on.
This is why a utility’s earnings tend to track its capital spending, and why management teams give investors a “rate base growth” target. Many large utilities guide to roughly 5 to 8 percent annual rate base growth and aim to grow earnings per share at a similar pace.
Approved operating costs, like fuel and storm repairs, usually get passed through to customers, often through automatic adjustment mechanisms. That pass-through is a big reason the cash flows are predictable.
The catch is that the regulator holds the pen. A commission can deny a rate increase, disallow certain costs, or set a lower allowed return, and any of those hits the company’s earnings directly. Regulatory relationships vary by state, which is why two utilities with similar assets can earn very different returns.
Florida Power & Light, owned by NextEra Energy (NEE), operates in a state that has generally let it recover its grid and solar spending, and it has grown its rate base steadily as a result. A utility in a more contentious state may file for a rate increase and walk away with far less than it asked for.
Rising rates work on this model slowly. Regulators reset the allowed return only every few years in a rate case, so when market interest rates climb, a utility’s approved return can lag behind for a while, which squeezes the gap between what it earns and what it pays to borrow. When rates eventually fall, the same lag works in the utility’s favor.
Not every utility is purely regulated, though. Some companies also own merchant or independent power plants that sell electricity at market prices instead of regulated rates.
That part of the business can earn more when power prices spike, but it’s far more volatile and behaves less like the steady utility most income investors want.
A name like NextEra is really two businesses: a regulated Florida utility and one of the largest renewable energy developers in the country, whose returns swing more with power prices and project economics. When you read about a utility, it’s worth knowing how much of its profit comes from the regulated side versus the market-exposed side.
The Advantages of Utility Stocks
Services are always in demand
Utilities are like consumer staples in the fact that they’re necessities.
They’ll always bring in revenue no matter how the economy is performing.
Defensive + Dividend Yield
So they’re a defensive flavor of equity.
Utilities tend to be in-demand during a low-rate environment because they’ll usually reliably pay out a consistent dividend.
This dividend rate will depend on the company. Two to five percent is fairly common.
The dividend yield is less important than the actual economic earnings of the business.
If a business is paying a dividend that isn’t covered by its earnings, then it’s not sustainable in the long run.
They’ll either need to:
- get the earnings up to meet the dividend (utility companies generally grow their earnings at about the rate of inflation), which can be difficult
- pay it with borrowed money (adds leverage and risk to a firm), or
- slash it down to a more sustainable level (which will hurt the stock, sometimes significantly)
Dividends are a type of distribution that implicitly says – “this is the amount of earnings that we think is guaranteed.”
This is not etched in stone like bond payments, which have to be met or risk default. But stocks are often punished significantly when they slash a dividend payment.
Lower correlation
This also provides the benefit of having a weaker correlation to global equity indices. Utilities are better equipped to handle a recession than most stocks because of their regular and consistent cash flow.
A hedge against inflation?
Utilities do have income generation capacity that can offset inflationary pressures, which can help preserve wealth for more conservative investors.
When prices go up in an economy, that usually holds true for essential services as well.
And utilities are typically lower risk compared to other types of stocks, so utilities can help diversify a portfolio to some extent with respect to inflation.
At the same time, utilities don’t necessarily yield more relative to their risk/volatility to the broader market either. But this doesn’t mean utility stocks are worse – it’s just part of their character.
A favorite of income investors
Income investors generally particularly like utilities for their consistency. Since utilities are considered safe and stable companies, they tend to be popular with investors looking for investment income.
Since utility stocks pay out dividends that tend to be attractive, they provide a steady stream of cash flow that can then be reinvested into the same company, different utilities, other sectors or asset classes, or used to fund one’s everyday expenses and overall lifestyle.
Utilities may not appreciate as much as technology companies in bull markets, but income investors don’t generally care about capital gains and prefer steady income producers.
When the economy is not booming and interest rates fall, utilities provide a good investment option.
Adding exposure to utility stocks can add value as part of a balanced portfolio since utilities can provide diversification when cyclical sources of cash flow are not doing as well.
More conservative investors who own bonds or other types of credit assets in their portfolio could add utilities as the sector offers income.
The dividend yield of SPY – the most popular S&P 500 ETF – is usually about two percent.
The yield offered on utilities is generally 1.5x to 2.5x times that. And with similar or lower volatility to the broader market.
That’s not to say that utilities are necessarily a better investment, but they do have characteristics that can add quality to a portfolio.
How utility dividends are taxed
Most utility dividends count as qualified dividends. That means they’re taxed at long-term capital gains rates, which are 0, 15, or 20 percent depending on your income, rather than at your ordinary income tax rate.
To get that treatment, you generally need to hold the shares for more than 60 days during the 121-day window around the ex-dividend date.
Not every payout qualifies. Some distributions include a return of capital, and a few utility-adjacent holdings are structured differently, so check the 1099-DIV form your broker sends.
If you own utilities mainly for the income, holding them inside a tax-advantaged account like an IRA or Roth IRA removes the yearly tax on those dividends, and over a few decades that difference compounds.
That said, tax rules change and depend on your own situation.
The Disadvantages of Utility Stocks
Here are a few of the main disadvantages of utility stocks.
Subject to broader market forces
Utilities are not without risk and can be more volatile than longer duration bonds, as they’re still subject to the broader movements of equity markets.
Even though companies have very different sources of cash flow, they’re all tied together through interest rates and their liquidity is closely tied together.
During bad market declines, utility stocks can still lose about half their value.
Keep in mind that utility stocks are still stocks at the end of the day. Bonds don’t provide the income generation capacity as utility stocks, but will provide a fundamentally different asset class.
Whether bonds make sense in any quantity in your portfolio (or whether you short them or employ a different strategy) will depend on your goals.
But utilities are still subject to broader forces.
Even if a company is doing well, its stock can still do poorly based on what happens with everything else.
Lower growth potential
Utility stocks may not be known for their huge growth. And utilities, in general, tend to have fairly limited exposure to the latest technological trends.
Many utilities are just mature companies that emit electricity or provide water from existing infrastructure. For those into tech, cryptocurrency, and meme stocks, such a stagnant industry probably isn’t exciting enough for them.
So, it’s important to remember that utility stocks may not provide material upside in terms of capital appreciation over time if economic conditions only slowly improve (in addition to income distribution in the form of dividends and, if applicable, share buybacks).
Of course, one could make the argument that being overweight utilities during low-growth “secular stagnation” periods isn’t necessarily a bad thing because interest rates will be low, which is a great environment for them as a whole.
And utilities are generally better for long-term investment than pure trading.
Plus, their income generation can help counterbalance any vagaries from shorter term strategies and trends.
The revenues of utility companies are not all that volatile.
Lower returns on equity (ROE)
Lower ROE is a very similar concept to the one we just covered.
There are several utilities that will offer investors dividend yields between 3 and 5 percent, plus the potential for 0-4 percent in additional capital appreciation per year.
This can be more than enough to investors who don’t want the volatility of typical stock investments.
But utilities typically only return in the vicinity of 7 to 10 percent on shareholders’ equity (ROE).
On the other hand, other types of stocks will range between 10 to 20 percent in ROE. While it’s common for things like tech stocks to go up or down by double-digit percentage points in a day or go up 50+ percent per year, that’s pretty unlikely with utilities.
This is because utilities generally have limited upside when it comes to growing their earnings relative to companies in other sectors.
It can happen if there’s a big event or markets are dislocated due to a bad recession where liquidity is out of whack, but utilities tend to be rather stable.
Owning utilities doesn’t necessarily mean that an investor won’t own growthier type companies as well – having a balanced allocation even within asset classes can make a lot of sense. But investors who like utilities tend to be more conservative than normal and all investments compete for our limited amount of capital.
The potential for longer-term capital appreciation is limited with utilities and the growth opportunities for most companies in the utilities sector are more constrained.
This naturally reflects in their stock price performance.
But the flip-side benefit to this is that with fewer opportunities to invest in projects for future growth, utility firms have more cash available to pay out dividends.
Weather risks
Utility stocks also face weather risks.
When there are fires, floods, and other natural disasters, utility companies will need to pay for the repairs.
Indebtedness
Utilities tend to carry higher levels of debt, which makes them rate-sensitive.
Are utilities better to own than bonds?
Utilities do have a bond-like character because they are generally considered to be “safe” investments with relatively predictable future cash flow.
Nevertheless, utilities stocks aren’t necessarily better than bonds in terms of their returns and risk/reward profiles.
This is because all investment assets can compete with each other through the use of leverage.
For example, if cash yields zero, bonds yield two percent, and safe stocks like utility stocks yield four percent, if you want the highest returns should you go with utilities?
The thing is that if you borrow cash at zero and buy bonds at two percent – such that you buy half with your own cash and half with borrowed money – you’ve doubled the prospective annual return from two percent to four percent.
So, leveraging the fixed income side just made bonds competitive with utility stocks in that case.
You also made the bonds riskier. But utility stocks and almost all stocks are already leveraged themselves – companies have debt. Debtholders are senior to common shareholders when it comes to claims on a company’s assets.
Sometimes yield curves get inverted which throws the lending relationship out of whack.
But normally you can take advantage of borrowing cash to capture a spread available in riskier assets (which exists due to credit risk, duration risk, liquidity risk, and so on).
Rising interest rates
Other factors can negatively impact utility stocks.
Rising interest rates hit utilities for two reasons:
1) All stocks are tied together by interest rates based on the process of how cash flows are discounted back to the present.
When rates rise, cash and bonds become more attractive to own, decreasing the allure of equities and other risk assets.
For example, the 4 percent dividend yield of a utility company might look attractive if cash yields zero and a 10-year bond yields 1-2 percent.
There’s still a 4 percent spread over cash and 2-3 percent spread over a mid-duration bond.
But if cash rates climb to two percent and a 10-year bond yields 3 percent, then there’s only a two percent spread and a one percent spread over a mid-duration bond.
An investor may decide that the slight bit of extra yield isn’t worth the extra risk and may sell the utility stock in favor of lower-risk investment assets.
2) Rising interest rates increase interest burdens.
Utility companies tend to be capital-intensive. It requires a lot of infrastructure to set up and run a utility. This means they require a lot of capital, a lot of which tends to be debt.
It’s common for a utility’s assets to be 65 to 75 percent debt.
Interest burdens on this debt load increase with higher interest rates.
And as utilities get larger, they tend to take on more debt. This should accompany more revenue.
But revenues tend to stay relatively constant, so higher interest rates will eat into any profitability by increasing interest expense and hitting margins, earnings, cash flow, and overall investor returns, which can adversely impact its stock.
Regulation
Utilities are heavily regulated. So, they are subject to changes in government policy.
Water, sewage, and power companies are commonly regulated by municipal (state/provincial/local) governments, so companies aren’t able to raise their rates very much.
From a trader or investor’s perspective, regulation is neither good nor bad on its own.
Regulations can increase the cost of doing business for a utility company and lower its potential profits.
But on the flip side, regulations can provide utilities with certain advantages that are good for investors.
For example, regulation can provide exclusivity in certain regions, reduce competition, and effectively give monopolistic characteristics to their business.
Understanding the regulatory framework is important when it comes to participating in utilities markets given regulators essentially set what kind of returns they can make as well as what projects they can and cannot take on as well as cost recovery.
It can be hard for individual investors to have a good grasp of the various different regulatory factors involved in the pricing of utility stocks.
That means it may not be easy for individuals to understand what fair value is for utility stocks based on what kind of returns they want. It also means it can be difficult to find hidden values if such utilities aren’t well covered by traditional research shops (banks, independent coverage) or don’t have large size and trading volume.
Aren’t Utility Cash Flows Capped?
Sort of. But not in the way most people mean it.
A regulated utility earns an allowed return on equity, usually around 9 to 10.5 percent, on its rate base (the capital it’s sunk into wires, pipes, plants, meters, etc.).
The regulator caps that rate. What the regulator doesn’t cap is the size of the base. So the company earns a limited percentage on a pile of capital that keeps getting bigger.
Think about what that does mechanically.
- The utility spends money upgrading the grid, gets the regulator’s sign-off, adds that spending to the rate base, and earns its allowed return on the new, larger number.
- More rate base leads to more earnings, which leads to more cash to pay you, which funds the next round of spending. It compounds. Slowly, but it compounds.
- Most big utilities guide to something like 5 to 7 percent rate base growth a year, and earnings tend to track it.
So why does the “capped” idea stick around?
Because the cap is real on the upside. You will not get a tech-stock year out of a regulated utility. The 50 percent moves are extreme right-tail events, because the regulator won’t let the return run that hot.
So if you’re in utilities that’s the trade you’re making, and you should go in knowing it.
But the same rules that keep returns from spiking also keep them from collapsing in a normal downturn. Approved costs like fuel and storm repairs mostly get passed through to customers.
The allowed return resets every few years in a rate case, so over time inflation works its way into the rates. That’s a floor of sorts.
A couple of caveats, because circumstances vary.
- The cap only covers the regulated part of the business. A company with merchant power plants sells into the market at whatever price it gets, and that cash flow swings a lot more.
- And a hostile regulator can hold the allowed return below what the company actually needs, which turns the cap into a genuine problem.
What to watch: the rate base growth rate and the allowed ROE. Those two numbers tell you most of what the cash flow can do.
Electricity demand is growing again
For most of the past 15 years, US electricity demand barely moved.
Efficiency gains from things like LED lighting and better appliances offset population and economic growth, so the total stayed close to flat. That has changed.
The US Energy Information Administration now projects record electricity demand in the years ahead.
Its December 2025 outlook had total consumption rising from about 4,110 billion kilowatt-hours in 2024 to more than 4,260 billion by 2026. Three things are driving the shift:
- AI data centers
- electric vehicles and electric heating, and
- a wave of new domestic manufacturing
Data centers are the biggest single driver. The Department of Energy’s 2024 report found they used about 4.4 percent of all US electricity in 2023 and could reach somewhere between 6.7 and 12 percent by 2028.
The range is that wide because nobody knows how fast the AI buildout will actually arrive.
The number of electric vehicles on US roads adds to it, expected to climb from under 6 million today toward roughly 50 million by the mid-2030s, with each car drawing steady load from the grid.
For utilities, more demand means more spending on generation and grid upgrades. And that spending is exactly how a regulated utility grows its rate base and its earnings.
American Electric Power, for example, told investors its customers had committed to roughly 24 gigawatts of new demand by 2030, about 18 of which came from data centers.
You have to be careful with the hype, though. Forecasts vary a lot and have been overstated before.
Goldman Sachs estimates only about half to 60 percent of the data center capacity scheduled will come online on time, because projects get delayed and cancelled.
Several states, including Ohio, have started requiring large data centers to pay for the grid upgrades they trigger so that households don’t end up covering the bill.
The demand growth is genuine, but it won’t lift every utility evenly, and a company in the wrong region or with the wrong regulator may not capture much of it.
Utilities vs. the Broader Stock Market (XLU vs. SPY)
Let’s look at some comparison charts of XLU, the most common utilities ETF, versus SPY, the most popular S&P 500 ETF.
Portfolio growth
Utilities (red line) had returned better than the broader market (blue line) until 2020-21.
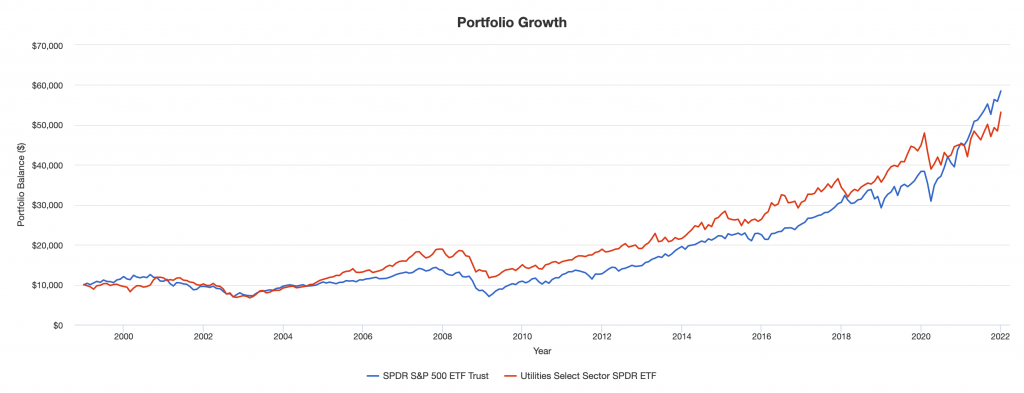
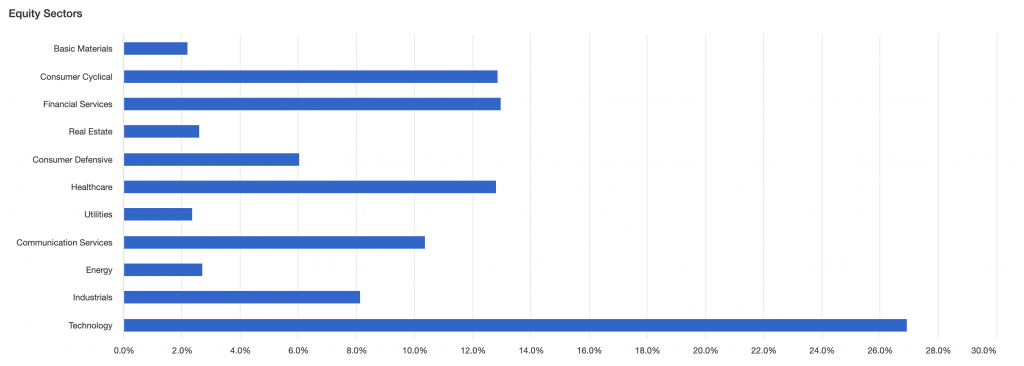
The makeup of the S&P 500 is usually about 2 to 3 percent utilities.
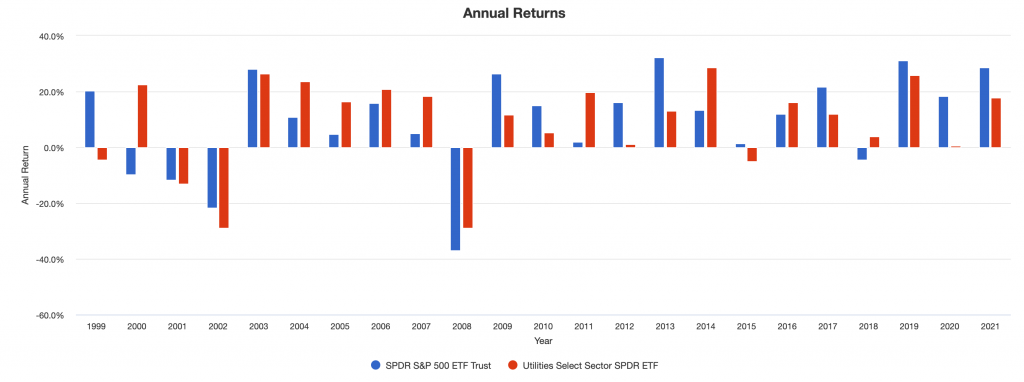
Annual returns
Utilities tend to not quite have the big ups and downs of the broader market.
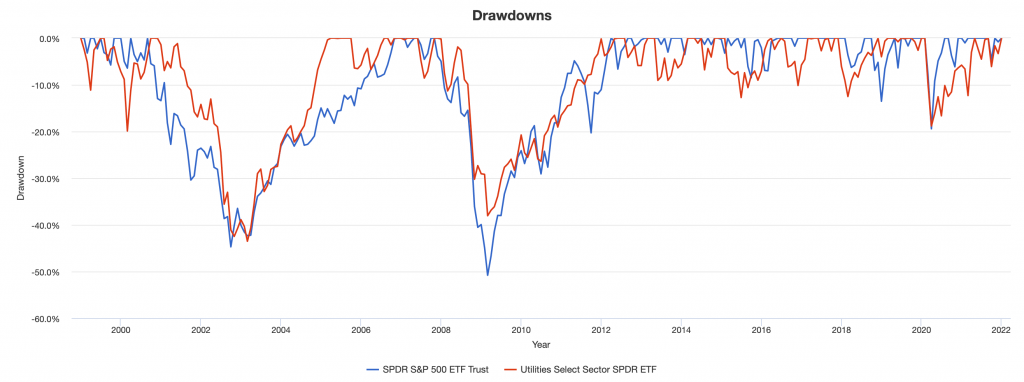
Drawdowns
Utilities may have shallower drawdowns overall, but not always.
We have a deeper set of statistics and metrics in the Appendix to this article.
How to Add Utility Stocks to an Investment Portfolio
Utilities are more defensive, so in more volatile, uncertain environments, investors may rotate into areas of the equity market like consumer staples and utilities.
During strong bull markets when the economy is growing and interest rates are starting to rise, the utilities sector generally underperforms.
Those looking to get into utilities should look for consistency of dividend payouts from the companies, mutual funds, and/or ETFs they consider.
The best ETFs are those that are liquid with low expense ratios.
XLU is the legacy SPDR ETF, with a history dating back to December 1998.
The Utilities Select Sector SPDR ETF is one of the cheapest and the most liquid funds that invests exclusively in S&P 500 utility companies. Its assets and volume are highest and it usually owns 25 to 30 different utility stocks.
VPU is cheaper overall, as is common with many Vanguard ETF products. IDU from iShares is another option.
The benefit of a utilities ETF is that it provides diversified exposure to the sector, and it should track the benchmark as closely as possible.
For those who want to get into futures, Globex has the product under the symbol IXU.
Futures have the benefit of lower margin requirements relative to stocks and ETFs.
However, they tend to be less liquid than stocks and ETFs and futures on sectors also don’t commonly have options markets associated with them like ETFs and stocks do.
When a utility stocks portfolio has diversification by buying several different stocks or by buying into an ETF, it can reduce the impact of the occasional dividend cuts (i.e., reductions or eliminations) that are made by utility companies that have issues with their cash flow.
For example, PG&E Corp (PCG) was a well-known example that hit the mainstream media back in 2017 when forest fires caused the companies liabilities to swell due to damage to its infrastructure and the state of California’s regulatory posture.
PG&E suspended its dividend in December 2017, filed for Chapter 11 bankruptcy in early 2019, and saw its stock fall by more than 60 percent, trading around 5 dollars at its low. It emerged from bankruptcy in July 2020 but didn’t pay a common dividend again until November 2023, almost six years later. An investor who owned only PG&E for the income would have gone years with nothing. Someone who held it as one slice of a utilities ETF barely noticed.
The iShares ETF provides not only large-cap utility stocks but also diversified exposure to both mid-cap and small-cap utilities that work to mirror the Dow Jones US Utilities Index, which includes the top 95 percent of US stocks constructed based on float-adjusted market cap.
Electric utility companies account for a little more than 50 percent of the fund, followed by multi-utilities and natural gas companies.
Because the ETFs underlying index is weighted by market cap, its top-10 holdings are all larger capitalization companies.
This includes firms like Duke Energy Corp (DUK), NextEra Energy (NEE), and Southern Co (SO). DUK and SO often have a dividend yield of around 4 percent in normal market environments, while NEE is about 2 percent.
The dividend yield of utility stock ETFs is generally around 3 percent.
When utilities still generally trade at a discount to the broader market (based most commonly on price-earnings ratios) despite rising interest rates and higher-than-normal volatility, they can remain attractive options for value- and income-oriented investors.
What to check before buying a utility stock
If you’re buying individual utilities rather than an ETF, a few numbers tell you most of what you need to know. None of these require a finance degree, and you can find them in a company’s investor presentations and quarterly filings.
- Dividend payout ratio. Utilities commonly pay out 60 to 75 percent of their earnings as dividends. A payout that sits above 90 percent of earnings, or above the company’s operating cash flow, is a warning sign that the dividend is being funded with debt rather than profit.
- Dividend coverage and growth. Check that earnings actually cover the dividend and that both are growing together. A dividend rising faster than earnings for several years in a row tends to end in a cut.
- Rate base and earnings guidance. Most large utilities publish a multi-year plan, something like “5 to 7 percent annual earnings growth through 2029.” Compare that growth rate to the dividend. If the dividend is supposed to grow faster than earnings, the math doesn’t hold up for long.
- Debt and credit rating. Utilities run on borrowed money, often 50 to 65 percent debt. Look at the credit rating from agencies like S&P or Moody’s. Investment-grade matters because these companies borrow constantly, and rising interest rates hurt the heaviest borrowers most.
- Which states it operates in. A utility in a state where the regulator lets it recover costs can earn close to its allowed return. One stuck with a hostile commission may file for a rate increase and get a fraction of it. This is harder for an individual investor to judge, but it matters more than the headline yield.
- Yield versus peers. A dividend yield far above other utilities usually isn’t a bargain. More often the market is pricing in a coming cut. If one utility yields 7 percent while its peers yield 3 to 4 percent, find out why before you buy.
Buying a basket through an ETF like XLU, VPU, or IDU spreads these risks across 25 or more companies, which is why most people who want utility exposure start there rather than picking single names.
How do I invest in utility stocks?
You can invest in utility stocks through any broker.
But like anything, there’s learning involved in taking on any investment. It’s important to understand whether something meets your personal goals and risk tolerances.
Final Thoughts
Utilities are companies that deliver essential services.
For example, these include things like water and sewer, gas, and electricity. Utilities are always in demand, no matter what point of the economic cycle.
This means the utilities sector tends to be one of the most stable areas of the stock market. It’s a type of consumer staple in a way, though they’re treated separately.
This is also true in terms of utility stocks’ day-to-day performance, tending to be more stable than other sectors that have bigger ups and downs.
Utility stocks also tend to hold up better in falling markets. When risk appetite drops, traders tend to dump the flimsiest, riskiest holdings first, things like cryptocurrency, unprofitable companies with unproven business models, and high-yield “junk” bonds. They’re usually slower to sell lower-risk investments like utilities when the environment turns bad.
Utility stocks are somewhere in the middle of the spectrum. They are riskier than most credit assets because they still represent claims to common shareholders who are at the bottom of the capital stack.
But they are usually seen as being lower-risk investments than the broader stock market.
One of the benefits of utilities is that they often pay dividends in excess of the broader market.
The ETFs XLU, IDU, and VPU invest across the US utilities sector, with an emphasis on the larger, more durable companies.
Utilities tend to underperform in early-cycle economies when liquidity is abundant, but outperform the wider stock market later in the cycle when recession fears loom and traders and investors want to own safe havens and assets that are more resilient to recessions.
However, as interest rates rise, utilities can be hit because of the large debt base and as cash and bond rates rise to compete with the earnings and dividend yields of utilities.
All stocks typically don’t perform as well when interest rates rise faster than what was previously expected because their future earnings growth begins to be discounted in the stock price.
As interest rates rise, investors typically are no longer receiving sufficient compensation for maintaining allocations to riskier high yielding assets, like stocks and so-called junk credit.
So they will typically transition back to less risky government or investment-grade bonds paying a comparable yield (or a lower yield with but less risk).
For income investors looking to make investment income through dividends, putting a portion of a portfolio in utility stocks could be a good decision.
Things like utilities and consumer staples are considered the most conservative corner of the stock market, which can be good for those with lower risk tolerance (e.g., retirees or those more concerned about capital preservation than big gains).
They sell an “everyday service” that may not return large amounts of profit or deliver tons of fireworks in a portfolio one way or another. But they can be part of a smart lower-risk portfolio.
Appendix
Below we have an appendix on various useful statistics comparing utility stocks (XLU) with the broader equity market (SPY).
| Arithmetic Mean (monthly) | 0.74% | 0.70% |
|---|---|---|
| Arithmetic Mean (annualized) | 9.19% | 8.75% |
| Geometric Mean (monthly) | 0.64% | 0.61% |
| Geometric Mean (annualized) | 7.98% | 7.54% |
| Standard Deviation (monthly) | 4.31% | 4.32% |
| Standard Deviation (annualized) | 14.92% | 14.97% |
| Downside Deviation (monthly) | 2.89% | 2.98% |
| Max. Drawdown | -50.80% | -43.51% |
| US Market Correlation | 0.99 | 0.40 |
| Beta(*) | 0.96 | 0.39 |
| Alpha (annualized) | -0.05% | 4.77% |
| R2 | 97.84% | 16.39% |
| Sharpe Ratio | 0.48 | 0.45 |
| Sortino Ratio | 0.70 | 0.64 |
| Treynor Ratio (%) | 7.49 | 17.21 |
| Calmar Ratio | 1.34 | 0.76 |
| Active Return | -0.40% | -0.85% |
| Tracking Error | 2.29% | 16.58% |
| Information Ratio | -0.18 | -0.05 |
| Skewness | -0.51 | -0.62 |
| Excess Kurtosis | 1.03 | 1.11 |
| Historical Value-at-Risk (5%) | -7.40% | -6.41% |
| Analytical Value-at-Risk (5%) | -6.35% | -6.41% |
| Conditional Value-at-Risk (5%) | -9.57% | -9.88% |
| Upside Capture Ratio (%) | 94.40 | 44.58 |
| Downside Capture Ratio (%) | 95.40 | 29.80 |
| Safe Withdrawal Rate | 4.98% | 5.75% |
| Perpetual Withdrawal Rate | 5.24% | 4.85% |
| Positive Periods | 174 out of 276 (63.04%) | 174 out of 276 (63.04%) |
| Gain/Loss Ratio | 0.90 | 0.89 |
| * US stock market is used as the benchmark for calculations. Value-at-risk metrics are based on monthly values. | ||
Drawdowns for Historical Market Stress Periods
| Stress Period | Start | End | SPDR S&P 500 ETF Trust | Utilities Select Sector SPDR ETF |
|---|---|---|---|---|
| Dotcom Crash | Mar 2000 | Oct 2002 | -44.71% | -42.47% |
| Subprime Crisis | Nov 2007 | Mar 2009 | -50.80% | -38.05% |
Drawdowns for SPDR S&P 500 ETF Trust
| 1 | Nov 2007 | Feb 2009 | 1 year 4 months | Mar 2012 | 3 years 1 month | 4 years 5 months | -50.80% |
| 2 | Sep 2000 | Sep 2002 | 2 years 1 month | Nov 2006 | 4 years 2 months | 6 years 3 months | -44.71% |
| 3 | Jan 2020 | Mar 2020 | 3 months | Jul 2020 | 4 months | 7 months | -19.43% |
| 4 | Oct 2018 | Dec 2018 | 3 months | Apr 2019 | 4 months | 7 months | -13.52% |
| 5 | Aug 2015 | Sep 2015 | 2 months | May 2016 | 8 months | 10 months | -8.48% |
| 6 | Apr 2012 | May 2012 | 2 months | Aug 2012 | 3 months | 5 months | -6.63% |
| 7 | Jan 2000 | Feb 2000 | 2 months | Mar 2000 | 1 month | 3 months | -6.43% |
| 8 | May 2019 | May 2019 | 1 month | Jun 2019 | 1 month | 2 months | -6.38% |
| 9 | Feb 2018 | Mar 2018 | 2 months | Jul 2018 | 4 months | 6 months | -6.28% |
| 10 | Sep 2020 | Oct 2020 | 2 months | Nov 2020 | 1 month | 3 months | -6.14% |
| Worst 10 drawdowns included above | |||||||
Drawdowns for Utilities Select Sector SPDR ETF
| 1 | Nov 2000 | Feb 2003 | 2 years 4 months | Mar 2005 | 2 years 1 month | 4 years 5 months | -43.51% |
| 2 | Dec 2007 | Feb 2009 | 1 year 3 months | May 2012 | 3 years 3 months | 4 years 6 months | -38.05% |
| 3 | Aug 1999 | Feb 2000 | 7 months | Sep 2000 | 7 months | 1 year 2 months | -19.90% |
| 4 | Feb 2020 | Mar 2020 | 2 months | Apr 2021 | 1 year 1 month | 1 year 3 months | -18.82% |
| 5 | Feb 2015 | Jun 2015 | 5 months | Mar 2016 | 9 months | 1 year 2 months | -12.73% |
| 6 | Dec 2017 | Feb 2018 | 3 months | Nov 2018 | 9 months | 1 year | -12.52% |
| 7 | Jan 1999 | Mar 1999 | 3 months | Jun 1999 | 3 months | 6 months | -11.14% |
| 8 | Jul 2016 | Nov 2016 | 5 months | Feb 2017 | 3 months | 8 months | -10.15% |
| 9 | May 2013 | Aug 2013 | 4 months | Feb 2014 | 6 months | 10 months | -9.05% |
| 10 | Jun 2007 | Jul 2007 | 2 months | Oct 2007 | 3 months | 5 months | -8.56% |
| Worst 10 drawdowns included above | |||||||
Rolling returns
Utilities are more historically stable based on measures of 1-, 3-, 5-, 7-, 10-, and 15-year rolling returns.
| Roll Period | SPDR S&P 500 ETF Trust | Utilities Select Sector SPDR ETF | ||||
|---|---|---|---|---|---|---|
| Average | High | Low | Average | High | Low | |
| 1 year | 8.89% | 56.25% | -43.44% | 8.66% | 42.26% | -33.74% |
| 3 years | 7.35% | 25.99% | -16.28% | 7.90% | 26.85% | -12.24% |
| 5 years | 7.76% | 22.86% | -6.67% | 8.42% | 22.44% | -1.71% |
| 7 years | 7.65% | 17.14% | -3.91% | 8.44% | 14.33% | 2.11% |
| 10 years | 7.38% | 16.55% | -3.45% | 7.97% | 12.88% | 2.14% |
| 15 years | 7.52% | 10.82% | 3.67% | 8.32% | 11.63% | 5.26% |