The Discounted Future: Backing Out What Markets Think

Financial markets represent the discounted future. As mentioned in a previous article where we discussed our big three market equilibriums that traders and investors need to pay attention to, we described the “risk premium” between different asset classes.
It tells you what the discounted future is like.
1. What’s the yield on cash?
Where does the central bank have interest rates pegged at? Cash is often defined as the “overnight” rate that the central bank controls, the three-month rate, or anything with a duration of less than one year.
2. What are the yields on bonds?
What are the rates further out along the yield curve (two years, five years, ten years, etc.) and what are the rates on bonds of different credit qualities?
3. What’s the “yield” on stocks?
If we project out earnings, if we divide that by the value of the index, this will give us an implied forward yield.
The price-earnings (P/E) ratio is one form of this. If we see a forward P/E ratio of 16, the reciprocal of that number (1/16) is the implied forward yield (1/16 = 6.25%).
Looking at the yields between cash, bonds, and stocks is important because it paints a picture of the discounted future.
Later on in the cycle, the spreads between cash and bonds, cash and stocks, and bonds and stocks tend to get too low because people are overly optimistic about the future. People will tend to extrapolate the past and assume that current conditions will continue.
When this occurs, assets become fully priced or overly priced and you would need to think about how to deal with that.
Do you want to own a lot of stocks when their forward yields are lower than they were and their risks are the same (i.e., your reward to risk is lower)?
Do you want to own a bunch of longer-duration bonds when you’re getting very low yields yet still subject to the same large degree of volatility?
When trading is fundamentally about the risk you’re taking relative to the reward, these are questions you’ll need to consider if owning assets for their yield.
Other data points and resources can help us think about what to expect going forward.
How do you determine the discounted future?
1. What are the unemployment rates?
Low unemployment rates regularly go hand in hand with low credit spreads and high risk asset prices. In other words, riskier credits begin to yield closer to the risk-free (sovereign debt) rates. The forward yields of stocks begin to become unattractive relative to their risks.
This means that businesses are broadly doing well and there’s plenty of liquidity.
However, central banks tend to start pulling that back toward the latter stages of the business cycle because they see or expect inflation to tick upward. That’s where they were one year ago in Q4 2018 by raising interest rates.
They overtightened policy and now they’re back to easing. This is necessary to keep the expansion going and to help support financial asset prices, which are very much part of the health of the real economy.
When unemployment rates are low, it shows that the capacity to squeeze more out of the current business cycle is limited. Fewer workers will be joining the workforce to help boost growth. At this phase, it means that growth risks are typically skewed to the downside. Namely, growth can’t get much better because the economy is running at or close (or maybe even a bit above) its operating capacity. But if there’s some type of credit or liquidity crunch that hits the economy, growth can get a lot worse.

(Source: US Bureau of Labor Statistics)
At the stage where we are now (relatively late in the business cycle), high forward returns for stocks, bonds, and risk assets is not very likely. Some investors will pull back on their allocation to risk assets during this phase.
2. What is the central bank doing?
Even if asset prices are relatively high, it doesn’t mean it’s necessarily a good time to sell.
Are the central banks easing policy? (The most important ones are those in the jurisdictions of the top 3-4 reserve currencies – US Federal Reserve, European Central Bank, Bank of Japan, and Bank of England.)
Are they lowering interest rates, are they buying assets?
If central banks provide sufficient liquidity, that’ll get into assets.
Even in highly indebted societies, assuming their debt is denominated in domestic currency, they can lower the rates and buy the debt.
At this stage, instead of the credit costs being reflected in the sovereign credit through higher yields (more debt = more risk), it is diverted into the currency channel (depreciates).
Japan, for example, is very indebted with its sovereign debt load at some 240 percent of annual GDP.
Yet, the country’s debt is very heavily denominated in yen, with zero to slightly negative interest rates throughout most of its yield curve. So, the debt serviceability burdens are low and not particularly risky.
Naturally, as rates become maxed out on the downside and relative interest rates can’t be changed (because they’re at zero or at somewhat negative levels), this means that currency volatility naturally has to pick up in order to avoid economic volatility.
Namely, to avoid economic growth being negatively impacted, then countries must lower their exchange rates.
This leads to “currency wars”, fixed exchange rate breakups, and generally larger currency risk for traders.
It will also tend to boost the value of alternative money assets like gold.
However, currency depreciations are very zero-sum in nature. When one currency depreciates, it benefits one country at the expense of another.
It does not bring about a global easing in the way a coordinated drop in interest rates (the primary form of monetary policy) or asset buying (secondary form of monetary policy) does.
3. How is debt tracking relative to earnings and output?
Even if debt is rising faster than incomes and earnings, that doesn’t mean imminent trouble because it depends on the servicing.
If you owe a billion dollars but it’s not due for another year, you are fine in the near-term even if the longer-term might be scary if you can’t figure out a solution.
Such a solution could be:
– extending out the maturity to buy yourself more time
– lowering the rate to make it easier to pay
– putting it on someone else’s balance sheet
– writing it down (basically defaulting and paying only a partial or no sum)
– austerity (spending less to be able to prioritize the debt)
– in the case of a sovereign government, you can print money to relieve the debt burden
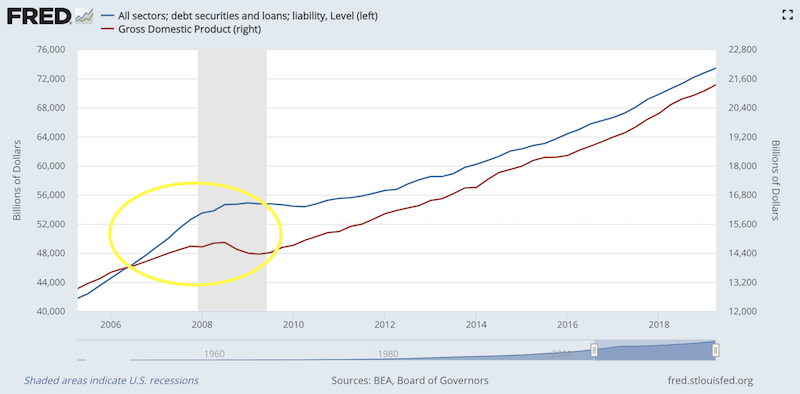
Fundamentally, it’s about getting debt and income growth back in line with each other. In the US and other countries, we were not there in 2006-07, but we are broadly there currently in that we see debt and output growing at about the same on aggregate and no runaway debt growth in any particular sector.

That said, debt growth in excess of income growth is not a sustainable set of conditions and eventually balance sheets become topped out as lenders become more cautious.
4. What’s the level of sentiment?
Sentiment can mean how are other investors positioned in a market.
Ways to gauge sentiment:
a) What’s the speculative positioning in various markets? You can often find this data for free through the CFTC on long and short positioning across commodities, equities, fixed income, currencies, and rates.
b) Various investment banks publish both soft data (surveys of future expectations) and hard data (what’s actually occurring right now). Survey-based measures generally take the pulse of what their brokerage clients are currently doing.
Other metrics include equity allocation as a percentage, cash allocation, the beta of clients’ top equity holdings, and proprietary bull and bear indicators.
Markets will classically top or bottom when there are no new buyers or sellers at the margin.
Accordingly, when a market is stretched long or short, there is risk is going with that consensus the larger it is. In July 2018, we saw bullish bets were at a record high with WTI crude in the $70s. We saw this in gold and Treasuries with large short positions in Q4 2018.
They best act as contrarian indicators. When everyone is on the same side of the boat, it doesn’t take much for the boat to flip.
5. How much growth is expected going forward is baked into asset prices?
Lower credit spreads mean higher bond prices, which means higher expected growth. The same is true for equities. Using discounted cash flow, you can back this out and compare it relative to what’s realistic.
If we assume that the US economy will see 1.7 percent real growth going forward, 1.5 percent inflation (3.2 percent nominal growth, adding the two together), and that traders will demand a 4 percent extra yield on stocks over cash over the long-run, that puts the S&P 500’s current fair value at about 3,200. This would put its “fair value” roughly in line with where stocks are currently (around the 3,000 mark at the time of posting).
Different traders will have different expectations regarding growth, inflation, and expected return over cash. Values are sensitive to the inputs.
Risk premiums over cash ranging from 3.0 percent to 5.0 percent give a valuation range running from 2,550-4,250. Risk premiums over cash ranging from 3.5 percent to 4.5 percent give a valuation range running from 2,833-3,643.
Measuring things out
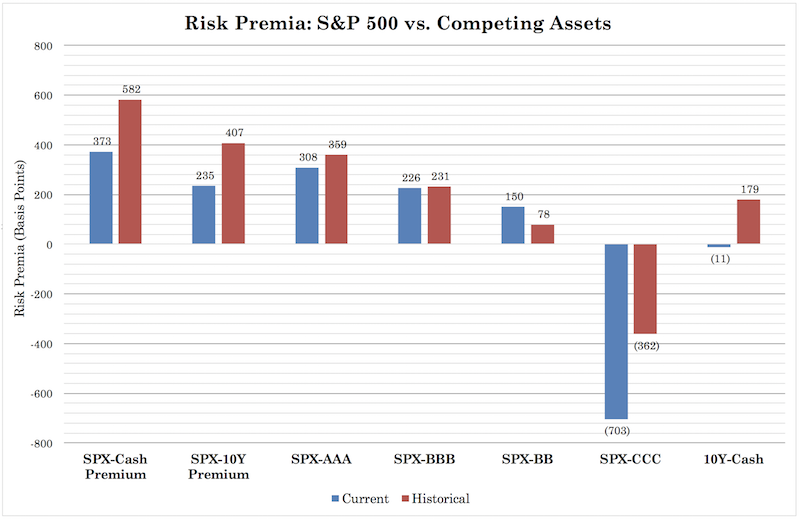
You can measure cash relative to bonds and stocks, and bonds relative to stocks.
Stocks don’t have an explicit yield, so forward earnings multiples can be used. For example, if stocks have a forward earnings yield of 20x, the inverse of that is the yield, or five percent.
To take an example, if cash is comparable to long-duration bonds that means you can probably expect monetary policy to be eased at some point – i.e., front end interest rates will come down to bring the cash/bonds spread back to a more normal risk premium.
These relationships can be plotted out on a chart to visualize it. An example of how it might look:

Discounting and extrapolations
Often, what’s discounted into markets is based on extrapolations of the past because that’s the frame of reference.
However, when things are going on that make these extrapolations unlikely to transpire, this provides opportunities to traders.
Example
US investors surveyed at the end of 2021 said they expected annual returns of 17.5 percent going forward.
Those kinds of returns are extremely high and would 5x one’s money every decade.
But it makes sense why that’s being extrapolated in the context of the 16.6 percent earned in the decade that went from 2011-end to 2021-end.
The source of those returns were largely due to high amounts of monetary stimulus after the 2008 recovery.
What made those returns good looking in the rear-view mirror is likely to make returns poorer looking forward.
Stimulus can only be stretched so far.
Interest rates can’t go far below zero.
Bond rates can’t go far below zero.
Fiscal stimulus combined with supportive monetary policy can only go so far, given the trade-offs of inflation, asset bubbles, and currency devaluation.
When inflation becomes a problem and financial stability is being compromised (e.g., bubbles, currency issues), then supportive policy has to be toned down.
And when interest rates are very low, that lengthens the duration of financial assets, which makes them more sensitive to interest rate increases.
Great past returns do not mean great forward returns. If profit margins and price-to-earnings multiples revert to the mean, then stock returns could be nothing spectacular going forward.