Treasury Term Premium Harvesting Strategies

Interest rates alone don’t explain why a 10-year Treasury pays more than a 3-month bill.
Interest rates are essentially the foundation of financial markets.
But the slope of the yield curve holds deeper information about risk, behavior, and expected compensation.
Every Treasury yield has two components:
- where short-term rates are expected to go, and
- what investors demand for locking in risk over time
That second part is the term premium and something that traders can capture.
This article looks at how to estimate it, interpret it, and build strategies around capturing it.
Key Takeaways – Treasury Term Premium Harvesting Strategies
- The term premium is the extra yield for holding long-term bonds.
- Estimated using models like ACM or KW.
- Riding the yield curve works best on a steep, stable curve. Buy longer bonds, sell early, and capture price gains as the bond rolls down.
- Duration extension is a direct way to express a term premium view.
- Shift into longer maturities when the premium looks high or yields are peaking.
- Steepener trades (long 10Y, short 2Y futures) bet on rising premium at the long end.
- Especially effective when QT or inflation fears return.
- Forward rate trades isolate embedded premium. For example, institutional traders might short 5y5y if forward rates overshoot their macro outlook.
- TIPS vs. nominal bonds can reveal inflation vs real premium.
- Long nominal, short TIPS if inflation risk is overcompensated and vice versa.
- Term premium trades are model-dependent. Cross-validate estimates and size cautiously to manage model and curve shape risk.
Understanding the Foundation: What Is the Term Premium?
The term premium is the compensation an investor demands for taking on interest rate risk by holding a long-term Treasury bond rather than rolling over short-term securities for the same period.
It’s what makes a 10-year Treasury yield more than just a forecast of where short-term rates might go.
If there were no term premium, the long-term yield would just be an average of expected short-term rates. But that’s not the case.
This excess return – often positive but sometimes negative – is linked to investor uncertainty about inflation, monetary policy, and economic conditions over the bond’s life.
Long-term bonds lock in fixed payments far into the future, and that’s risky.
If rates rise, those bonds lose value. The term premium is what investors demand to take that ride.
You can’t see the term premium on a screen like you can a bond’s yield.
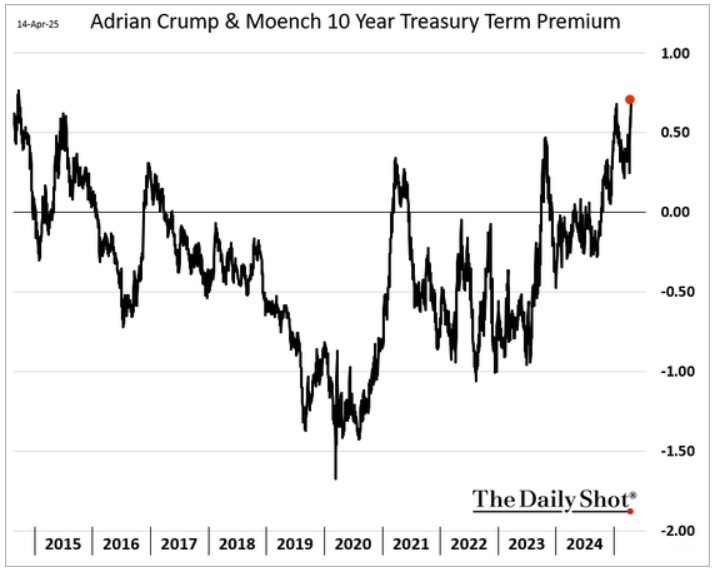
It’s estimated using models like the ACM (Adrian, Crump, Moench), KW (Kim-Wright), or CR (Christensen-Rudebusch).
These models use observed yields and macroeconomic data to estimate what portion of a yield comes from expected future rates and what’s left over – i.e., the premium.
Different models, different outcomes. This is model risk. One model may say the 10-year premium is 75 basis points; another may say it’s higher, lower, or even negative.
That creates a major challenge for implementation, because you’re betting on an estimate, not a fact.
Term Premium Models
Below is a table summarizing various term premium models.
| Study/Source | Focus Area | Key Finding | Implication for Harvesting |
| Adrian, Crump, Moench (ACM) / NY Fed | Estimation Model | Provides widely used estimates of term premia based on yields and macro/financial variables. | Offers a benchmark for assessing premium levels, but subject to model risk. |
| Christensen & Rudebusch (CR) / SF Fed | Estimation Model (AFNS) | Decomposes yields into expectations and premium using Nelson-Siegel framework; estimates vary over time. | Provides alternative estimates; highlights model dependence and time-variation. |
| Vayanos & Vila / Li et al. | Supply/Demand, Habitat Effects | Investor demand (preferred habitat) and arbitrageur risk aversion significantly impact yields and term premia. | Highlights importance of flows and market structure; suggests premium isn’t just about macro risk. |
| Du, Hébert, Li / Du, Im, Schreger | Intermediary Constraints | Post-GFC, dealer balance sheets and positions strongly influence Treasury pricing and spreads (regime shift). | Suggests intermediary behavior is a key driver, potentially affecting strategy viability based on market conditions. |
| Krishnamurthy & Vissing-Jorgensen | Convenience Yield / Debt Supply | US Treasuries historically had a convenience yield (lower borrowing cost) relative to other safe assets. | Quantifies the “specialness” of Treasuries; changes in this premium affect relative value. |
| Cieslak et al. | Central Bank Communication & Policy | Fed communication (monetary/non-monetary news) and policy cycle significantly impact asset returns/premia. | Underscores need to analyze Fed actions/words closely; policy uncertainty affects premium and strategy risk. |
| Du, Forbes, Luzzetti | Quantitative Tightening (QT) | QT announcements raise yields, steepen curves; implementation modestly impacts funding/convenience yields. | Confirms QT puts upward pressure on premium; active vs. passive QT matters. |
| Greenwood, Hanson, Stein / Hudson Bay | Treasury Issuance Strategy (ATI) | Treasury’s debt maturity choices can influence yields/premia independently of Fed policy (ATI). | Adds complexity; Treasury actions can reinforce or counteract Fed, impacting curve shape and strategy outcomes. |
| PIMCO / Barclays / NB | Practitioner Views / Recent Trends | Acknowledge estimation difficulty; note recent premium rise linked to inflation/fiscal/policy factors. | Provides timely market context; highlights factors currently driving practitioner views and potential strategy shifts. |
| Harvey | Yield Curve & Economic Growth | Yield curve slope (related to premium/expectations) historically predicts economic growth. | Links term structure dynamics to broader macro cycle, relevant for assessing risks over longer horizons. |
Note that these are heavily skewed toward academic models.
Market models used by actual traders, hedge funds, banks, and investment firms are proprietary and largely kept under wraps (markets are competitive).
While both academic researchers and market practitioners acknowledge the term premium’s significance and time-variation, their approaches often differ.
Academic work often focuses on developing sophisticated theoretical and empirical models to understand underlying drivers, while practitioner reports tend to emphasize interpreting readily available model outputs and linking them to current markets and investment implications.
Below is an example ACM Treasury term premium chart:
Why It Exists: The Theories Behind the Premium
Liquidity preference theory suggests investors want short-term, more liquid instruments.
If they’re going to give that up and go long, they need extra compensation. That’s the premium.
Keynes introduced the idea decades ago. It still holds weight.
Preferred habitat theory says certain investors – think pension funds – prefer specific maturities based on their liabilities. They’ll stay in that “habitat” regardless of price.
This demand can distort prices and create a premium (or discount) in certain maturity buckets.
Market segmentation theory says investors don’t view all maturities as interchangeable.
The yield curve isn’t just one smooth arbitrage-free line – it’s made of segmented supply and demand zones. So term premia emerge as a byproduct of these imbalances.
There’s also inflation risk and real rate uncertainty. A long bond exposes you to the possibility that inflation eats into your coupon. Investors demand protection for that.
And macro unknowns – policy shifts, shocks, recessions – further builds the case for why a premium might exist.
Drivers of the Term Premium
Research has investigated various potential drivers:
Interest Rate and Macro Uncertainty
Early theories emphasized liquidity preference.
Finance-oriented models often focus on uncertainty about the short-term interest rate path, while macro-finance approaches link the premium to uncertainty surrounding economic growth and inflation.
Yield curve volatility itself contains information about market expectations and risk.
Central Bank Policy
Post-GFC research heavily emphasizes the impact of monetary policy.
QE/LSAPs have been shown to compress term premia through duration-risk and local-supply channels.
The effects of QT are also being actively studied, with findings suggesting upward pressure on yields.
Central bank communication and perceived policy reaction functions (like the “Fed put”) also influence risk premia.
Supply, Demand, and Habitat Effects
Models incorporating preferred investor habitats and granular demand functions show how shifts in Treasury supply and the holdings of specific investor groups (e.g., foreign investors, banks, mutual funds) impact yields and premia, mediated by the risk appetite of arbitrageurs.
Treasury supply changes can also affect bank funding costs and deposit flows.
Intermediary Constraints
A growing literature highlights the role of financial intermediaries (particularly primary dealers) and their balance sheet constraints in Treasury market pricing, especially post-GFC.
Dealer net positions have shown strong correlations with yield curve shapes and deviations from covered interest rate parity, suggesting intermediaries’ capacity to warehouse risk influences market premia.
Liquidity and Global Factors
Studies have examined the term structure of liquidity premia within the Treasury market and the specific liquidity premium embedded in TIPS/inflation-linked bonds.
Others measure the unique “convenience yield” or premium of US Treasuries relative to other near default-free sovereign bonds.
Strategy Framework: How to Harvest the Term Premium
Riding the Yield Curve
When the yield curve is upward sloping, longer-maturity bonds yield more than short ones.
If you buy a 10-year bond and sell it a year later, it’s now a 9-year bond, typically (but not always) priced at a lower yield. That means higher price.
You collect the coupon plus price appreciation. That’s the roll-down.
This strategy banks on stability. The curve must not flatten, and certainly must not invert. If yields rise broadly, especially at the long end, price losses can erase gains.
You’re not holding to maturity. You’re profiting from the curve’s slope.
But if the slope is purely driven by expectations of rate hikes – rather than a genuine term premium – you could end up losing.
The slope alone isn’t enough; you need to know why the curve is shaped the way it is.
Duration Extension
Here, you bet that the long end of the curve offers attractive compensation. You shift your portfolio from short-term to longer-term bonds.
You absorb more duration, take more price risk, and hope the yield you lock in plus potential price appreciation outweighs the risk.
This is a directional trade. It works when yields fall or stay flat. If long yields rise, your longer bonds take a hit.
Unlike riding the curve, you’re not exploiting slope for roll-down.
You’re capturing carry and convexity. You’re betting that the long bond’s yield more than justifies the risk.
If your model overstates the premium, you’re stuck holding a lot of duration at precisely the wrong time.
Forward Curve Trades
You can look at forward rates implied by today’s curve – say, the 5y5y (the 5-year rate starting 5 years from now). If that forward rate seems too high relative to your forecast, you might bet it will come down.
Entering a receiver swap (getting fixed) at that forward rate expresses that view.
This kind of trade focuses on term premium embedded in forwards.
But you need a forecast for the future path of short-term rates – and confidence that your model is better than the market’s.
Curve Steepeners and Flatteners
These are relative value trades. Go long the 10-year and short the 2-year if you think the curve will steepen. You benefit if the long end sells off or the front end rallies.
A steepener may indicate rising term premium. A flattener may signal falling premium or expectations for rate cuts.
These trades aren’t pure bets on term premium – they’re bets on relative movements – but they often tie back to changes in the premium’s distribution across maturities.
We have more specific trade ideas toward the end of this article.
Real-World Challenges: Volatility, Estimation, and Macro Noise
The term premium is anything but stable. Since the 1980s, it’s trended lower, particularly post-GFC when QE dominated.
Central banks bought long bonds, compressed duration supply, and effectively reduced the term premium. Models confirm this.
But in 2022 and 2023, things changed. Inflation surged. QT replaced QE. Fiscal deficits ballooned. Supply increased.
Models like the ACM began showing the premium rising sharply again. The steep sell-off in 2023 was in part a term premium shock.
So, the premium moves and sometimes violently. A strategy built on a stable or positive premium can implode if the premium shrinks, turns negative, or becomes more volatile.
Volatility itself feeds back into the premium.
The more uncertain the path of rates or inflation, the more premium investors will demand. But that also means more risk in trying to harvest it.
| Risk Type | Description | Potential Impact on Harvesting Strategies | |
| Interest Rate | Risk of loss due to changes in the overall level of interest rates | Capital losses on long-duration holdings, potentially offsetting premium/coupon | |
| Yield Curve | Risk from changes in the shape (slope, curvature) of the yield curve | Reduced/negative roll-down (flattening), capital losses (adverse steepening) | |
| Reinvestment | Risk of reinvesting coupons at lower rates than initial YTM | Lower overall realized return, especially for long horizons / high coupons | |
| Model | Risk that the term premium estimation model is inaccurate | Strategy based on flawed premise, failure to capture actual premium | |
| Liquidity | Risk of inability to trade quickly at a fair price | Increased transaction costs, difficulty executing, losses in stressed markets |
Macro Forces That Drive the Game
Inflation matters, not just its level, but how uncertain it is. Stable inflation supports lower premia. Volatile inflation drives it up (as well as affects other market phenomena like the stocks-bonds correlation).
That makes recent years more treacherous for bond investors trying to time or ride the curve.
Fed policy is another lever. QE compressed the premium. QT expands it.
Rate guidance, dot plots, speeches – all influence the forward path of rates and therefore the difference between yields and expectations.
A dovish Fed lowers term premium by reducing uncertainty. A hawkish surprise does the opposite.
Fiscal policy adds more noise. More issuance means more supply. More supply means yields must rise unless demand keeps up.
If the Fed is no longer buying (QT) and the private market is saturated, the premium rises. That’s the market demanding more compensation for absorbing more risk.
Treasury issuance strategy can matter too. If the US issues more bills and fewer bonds, it reduces duration in the market. That can support lower term premia.
If it tilts toward long bonds, duration risk increases, and so does the premium. This is “activist Treasury issuance.”
Instruments: How to Actually Execute These Strategies
You can use cash Treasuries, futures, ETFs, or swaps.
Individual bonds give precision. You pick your maturity, manage roll-down, and structure your exposure tightly. But liquidity can vary, especially for off-the-run bonds.
ETFs like IEF or TLT offer simplicity and liquidity. You give up control over exact maturities but get diversification and easy access.
Futures are capital-efficient. You get big exposure with small initial margin. That’s great for steepener or flattener trades. But they come with roll risk and require careful cash management.
Swaps allow precise curve positioning, especially on forwards. Institutional players use them to express views on where the premium will move next. But they’re opaque and complex for non-specialists.
Model Risk
Your strategy depends on an estimate. And different models give different answers. That’s a problem.
ACM might say the 10-year term premium is up 80 basis points. KW might say 40. CR might say something else. Surveys might say it’s near zero.
If you base a strategy on the ACM estimate and it’s wrong, you’re exposed.
Maybe the premium wasn’t actually high. Maybe it was already priced in. Maybe your whole forecast was model noise.
The best practice? Cross-validate. Don’t rely on a single model.
Use ACM, KW, CR, and forward-implied rates. Use surveys as a sanity check. Look at breakevens. Compare to historical levels. Consider what the premium should be in a world with current inflation and QT.
Execution: Less Glamorous, But Important
Transaction costs eat your edge (why adding alpha isn’t just zero-sum, but negative-sum). Bid-ask spreads, especially in less-liquid instruments, can be wide during stress.
Futures reduce friction but bring basis risk – your hedge might not behave exactly like the cash position you’re targeting.
Financing costs matter. If you’re using leverage, repo rates or margin interest subtract from returns. Sometimes these hidden costs kill a strategy that looks good theoretically.
You also need a plan. When will you exit? What will make you reallocate? What if the Fed surprises? What if your model estimate shifts a lot?
Trade Examples: Term Premium Harvesting
Below we have several concrete, specific trade examples that reflect real-world Treasury term premium harvesting strategies, tailored to the instruments and execution principles outlined.
These trades each reflect a practical structure that traders, asset managers, or institutions could actually implement to express a view on the term premium.
Cash Bond Roll-Down Strategy Using Off-the-Run 10-Year Treasury
- Instrument – Off-the-run (i.e., older issuance) 10-year Treasury bond purchased at a slight discount.
- Strategy – Buy the bond when it has 10.2 years to maturity, sell after 6 months when it becomes a 9.7-year bond.
- Objective – Capture both coupon income and roll-down return as the bond shifts down the curve, assuming a steep curve and no shift in yields.
- Risk – Curve flattening or parallel upward shift can eliminate expected gains or cause capital losses.
ETF-Based Duration Extension Trade
- Instrument – Sell SHY (1–3 Year Treasury ETF), buy TLT (20+ Year Treasury ETF).
- Strategy – Extend the duration of the portfolio by rotating from short-duration to long-duration ETF exposure.
- Objective – Harvest higher yields at the long end, anticipating stabilization or a decline in long-term rates.
- Execution Benefit – ETFs offer easy rebalancing and ample liquidity.
- Risk – If long-term yields rise sharply, duration exposure inflicts mark-to-market losses. ETF management fees reduce net return. Long/short trades have borrowing costs + potential margin costs.
Futures-Based 2s10s Steepener Trade
- Instrument – Long 10-year Treasury futures (TY), short 2-year Treasury futures (TU).
- Trade Size Example – Long 8 TY contracts, short 10 TU contracts to match DV01 exposure.
- Objective – Bet on steepening of the yield curve due to rising term premium at the long end.
- Catalyst – Anticipation of Fed rate cuts combined with rising inflation uncertainty pushing long yields higher.
- Risk – If curve flattens or inverts, this trade can lose money despite being theoretically duration neutral.
Interest Rate Swap Curve Trade
- Instrument – Receive fixed in 10-year swap, pay fixed in 2-year swap.
- Strategy – Express view that long-end swap rates (which embed more term premium) are mispriced versus short-end.
- Objective – Capture expected mean-reversion in term premium if 10-year swap rates rise more than 2-year swap rates.
- Considerations – Requires understanding swap spread dynamics, counterparty risk, and collateral requirements.
Forward Rate Arbitrage Using Futures Strip
- Instrument – Construct synthetic forward exposure using Eurodollar or SOFR futures strip.
- Trade – Sell forward-starting 5-year rate (5y5y implied from strip) if it’s significantly above your macro-based rate forecast.
- Objective – Express view that forward curve embeds an overly large term premium.
- Execution – Requires accurate model of implied forward pricing and knowledge of Fed path probabilities.
- Risk – Incorrect forecast of the actual future rate path or persistence of high premia.
Treasury Futures vs. TIPS Breakeven Spread Trade
- Instrument – Long nominal 10-year Treasury futures, short equivalent duration in TIPS ETF (e.g., TIP).
- Strategy – Take directional view that term premium embedded in nominal bonds is higher than the inflation risk premium.
- Objective – Isolate the real term premium component by hedging out inflation expectations.
- Risk – Misestimation of liquidity premium in TIPS, or sudden shift in inflation sentiment.
Barbell Portfolio Rebalancing
- Instrument – 50% in 2-year bonds, 50% in 30-year bonds.
- Rebalancing Strategy – When yield curve steepens, tilt more toward 30-year to harvest higher term premium.
- Objective – Harvest premium by overweighting long end during episodes of elevated curve steepness.
- Trade Trigger – Curve slope (e.g., 30y – 2y) exceeding historical percentile threshold.
- Risk – Curve inversion or rapid selloff in the long end leads to outsized losses due to duration concentration.
Related: Barbell Portfolio Strategies
Option Overlay on Long Treasury Futures
- Instrument – Long TY futures, short out-of-the-money TY puts (i.e., selling downside vol).
- Strategy – Generate premium from options to enhance yield while holding duration exposure.
- Objective – Monetize the high implied volatility component often associated with rising term premium environments.
- Risk – Sharp sell-off in long bonds can cause large losses in both futures and short option leg.
Related: Option Overlay Strategies
Synthetic Duration Extension Using Futures
- Instrument – Add long position in Ultra Long Bond futures (UB) to cash bond portfolio.
- Context – Treasury cash portfolio is 5-year average duration. Add UB futures to synthetically push effective duration to 10+.
- Objective – Access long-duration risk when term premium appears attractive without disturbing cash holdings.
- Execution – Must calculate hedge ratios (e.g., DV01) precisely.
- Risk – Futures basis volatility, financing drag, and convexity mismatch. Can be more tactical. Often traders/investors want their portfolios to have less duration because that’s a component of equity and portfolio risk.
Cross-Market Term Premium Arbitrage: US vs. Germany
- Instruments – Long US 10-year Treasury futures, short German Bund futures (Euro-Bund).
- Strategy – Exploit relative difference in estimated term premia between US and German sovereigns.
- Rationale – If US 10-year premium is estimated at 100 bps and Germany’s at 30 bps, bet on convergence or mean-reversion.
- Execution – Hedge FX exposure using USD/EUR forward or cross-currency basis swaps.
- Risk – Currency misalignment, ECB policy divergence, relative liquidity shifts.
Conclusion
Term premium harvesting isn’t about holding a bond for 10 years and hoping.
It’s about understanding the shape of the curve, what’s driving it, and where it might go.
You’re trading an unobservable, unstable, model-dependent estimate – so you need rigor, flexibility, and humility.
Get the macro view wrong, and the premium might be negative. Misjudge curve dynamics, and roll-down turns into a headwind.
Pick the wrong model, and your whole strategy rests on a bad foundation.
But if you get it right – if the premium is truly elevated, if you can ride or extend at the right time – there’s a path to excess return.
Article Sources
- GRANULAR TREASURY DEMAND WITH ARBITRAGEURS
- The key drivers of 10-year US Treasury yields
- THE U.S. TREASURY PREMIUM
- Treasury Term Premia
- Intermediary Balance Sheets and the Treasury Yield Curve*
The writing and editorial team at DayTrading.com use credible sources to support their work. These include government agencies, white papers, research institutes, and engagement with industry professionals. Content is written free from bias and is fact-checked where appropriate. Learn more about why you can trust DayTrading.com