Synthetic Data in Trading

In finance, stress testing is an important practice for assessing the resilience of portfolios and trading strategies under various adverse scenarios.
Historical data can provide insights, but it’s limited by the fact that we only have one run through history.
This is where synthetic data comes into play.
It offers a complement to traditional backtesting and live testing methods.
Synthetic data allows traders and financial professionals to simulate a wide range of scenarios, including both common events like recessions and stagflation, as well as more extreme and rare occurrences such as severe market crashes, natural disasters, and geopolitical crises.
It can also be applied at scale.
Historical and live data is limited. Synthetic data can be created in whatever quantity necessary – any event or scenario and over any timeframe necessary.
By leveraging synthetic data, traders and portfolio managers can better prepare for potential risks and optimize their strategies for a variety of market environments.
Key Takeaways – Synthetic Data in Trading
- Synthetic data enables simulation of scenarios beyond limited historical data.
- Allows traders to stress-test portfolios against extreme, rare events like market crashes, currency crises, or geopolitical crises.
- Monte Carlo simulation and machine learning techniques like GANs can generate realistic synthetic financial data.
- Helps traders develop and stress test strategies across a broader range of market conditions and over longer periods of time.
- Synthetic data requires calibration and validation to make sure it accurately represents real-world market dynamics and avoids overfitting in trading models.
The Need for Synthetic Data in Finance
Limitations of Historical Data
Historical financial data, while important in backtests, has several limitations:
Limited sample size
We only have one historical timeline to analyze.
The way things transpired was just one roll of the dice out of many that were possible.
Changing market dynamics
Past events may not accurately represent future scenarios.
Rare events
Extreme scenarios may not be adequately represented in historical data.
Evolving regulations and technologies
Markets are constantly changing in various ways (e.g., the diversity of the players, analysis techniques, new technologies, changes in the world around us).
While it’s commonly believed that the future will be a slightly modified version of the past, this isn’t always a quality assumption.
Benefits of Synthetic Data
Synthetic data addresses these limitations by:
- Providing larger datasets for analysis
- Allowing for the simulation of unique/novel scenarios
- Enabling the creation of extreme event simulations
- Facilitating the exploration of hypothetical market environments to really stress test a portfolio
Creating Synthetic Financial Data
Data Generation Techniques
Several methods can be employed to generate synthetic financial data:
- Monte Carlo simulations
- Generative Adversarial Networks (GANs)
- Agent-based modeling
- Time series modeling (e.g., ARIMA, GARCH)
- Bootstrapping and resampling techniques
Key Considerations in Data Generation
When creating synthetic data for portfolio stress testing, consider the following factors:
- Asset correlations
- Volatility clustering
- Fat-tailed distributions
- Regime changes and market transitions
- Liquidity dynamics
- Macroeconomic factors
Designing Stress Scenarios
Common Stress Scenarios
- Recessions
- Stagflation
- Market crashes
- Interest rate shocks
- Currency fluctuations
Extreme and Rare Events
- Severe debt crises (e.g., 1929, 2008-like events)
- Natural disasters and climate events
- Wars and geopolitical conflicts
- Hyperinflation
- Political extremism
- Extreme commodity shortages
- Currency collapses (80% of the currencies that have existed since 1850 have died or been thoroughly depreciated)
- Growth collapses
- Extreme unemployment scenarios
Scenario Parameterization
When designing stress scenarios, consider the following parameters:
- Magnitude of shocks
- Duration of events
- Speed of onset
- Recovery patterns
- Sector-specific impacts
- Cross-asset correlations during stress events
Implementing Synthetic Data in Portfolio Stress Testing
Data Preparation and Cleaning
- Ensure data consistency and quality
- Address missing values and outliers (that aren’t supposed to be outliers)
- Normalize and scale data as needed
- Align time series data across different assets and factors
Model Selection and Calibration
- Choose appropriate models based on portfolio composition and objectives
- Calibrate models using historical data and expert knowledge
- Validate models using out-of-sample testing (to make sure it performs well on data it hasn’t seen before and isn’t optimized based on historical data)
- Incorporate model unknowns and parameter sensitivity analysis
Simulation Execution
- Set up a simulation environment
- Define scenario parameters and stress factors
- Generate synthetic time series for relevant assets and factors
- Apply portfolio allocation and trading strategies
- Calculate performance metrics and risk measures
Analysis and Interpretation
- Evaluate portfolio performance across scenarios
- Identify vulnerabilities and stress points
- Analyze the impact of different factors on portfolio outcomes
- Compare results with historical backtests and live testing data (if there’s enough of a sample size).
With new portfolios live testing may not generate enough data fast enough.
It can take a few years to get a statistically significant sample, but it depends. Long-term position trading can take much longer to test than HFT.
Advanced Techniques in Synthetic Data Generation
Machine Learning Approaches
- Generative Adversarial Networks (GANs) for realistic data creation
- Reinforcement learning for agent-based modeling
- Deep learning for complex pattern recognition and generation
Hybrid Approaches
- Combining historical data with synthetic extensions (e.g., such as bootstrapping or resampling). This involves keeping forward synthetic data close to historical data.
- Blending multiple data generation techniques.
- Integrating expert knowledge with data-driven approaches. For example, portfolio risk factors can often be known before stress testing them.
Challenges and Considerations
Data Quality and Realism
Making sure that synthetic data accurately represents real-world financial dynamics is important.
This involves:
- Validating statistical properties of generated data. For example, if you’re simulating bond prices, the data should match the liquidity, duration, credit risk, and other aspects of the bonds.
- Comparing synthetic data distributions with historical data
- Conducting reality checks with domain experts
- Continuously refining data generation models
Overfitting and Model Risk
To avoid overfitting and manage model risk:
- Use multiple models and approaches
- Implement cross-validation techniques
- Regularly update and recalibrate models
- Maintain transparency in model assumptions and limitations
Applications Beyond Stress Testing
Portfolio Optimization
- Use synthetic data to explore a wider range of allocation strategies
- Optimize portfolios for resilience across diverse scenarios and events
- Develop adaptive strategies that respond to changing markets
Risk Management
- Improve Value at Risk (VaR) and Expected Shortfall calculations (among other tail risk measures)
- Improve tail risk assessment and management
- Develop more comprehensive risk dashboards and potentially early warning systems
Trading Strategy Development
- Backtest strategies across a broader range of market environments
- Identify strategy vulnerabilities and failure modes
Product Development and Pricing
- Simulate market conditions for new financial products
- Stress test structured products under various scenarios
- Develop more accurate pricing models for complex/exotic derivatives
Future Directions in Synthetic Data for Finance
Integration with Real-Time Data Streams
- Develop systems that automatically generate synthetic data based on historical/live data feeds
- Implement continuous monitoring and portfolio adjustment based on synthetic projections
Explainable AI in Synthetic Data Generation
- Provide clear explanations of scenario assumptions and generation processes
- Enable stakeholders to understand and trust synthetic data-driven insights
Example of Synthetic Data
Let’s take the following code (be sure to indent where appropriate given Python is sensitive to that):
import numpy as np
import pandas as pd
import matplotlib.pyplot as plt
def generate_synthetic_stock_prices(initial_price, mu, sigma, days, num_simulations):
"""
Generates synthetic stock prices using Monte Carlo simulation.
Parameters:
initial_price (float): The initial stock price.
mu (float): The expected return (mean).
sigma (float): The volatility (standard deviation).
days (int): The number of days to simulate.
num_simulations (int): The number of simulations to run.
Returns:
DataFrame: A DataFrame with simulated stock prices.
"""
dt=1/252# daily time step assuming 252 trading days in a year
prices=np.zeros((days, num_simulations))
prices[0] =initial_price
fortinrange(1, days):
random_shocks=np.random.normal(mu*dt, sigma*np.sqrt(dt), num_simulations)
prices[t] =prices[t-1] * (1+random_shocks)
returnpd.DataFrame(prices)
# Parameters - Model this after whatever you're trying to simulate
initial_price = 100
mu = 0.0005 # daily expected return
sigma = 0.02 # daily volatility
days = 252 # 1 year of trading days
num_simulations = 1000
# Generate synthetic stock prices
synthetic_prices = generate_synthetic_stock_prices(initial_price, mu, sigma, days, num_simulations)
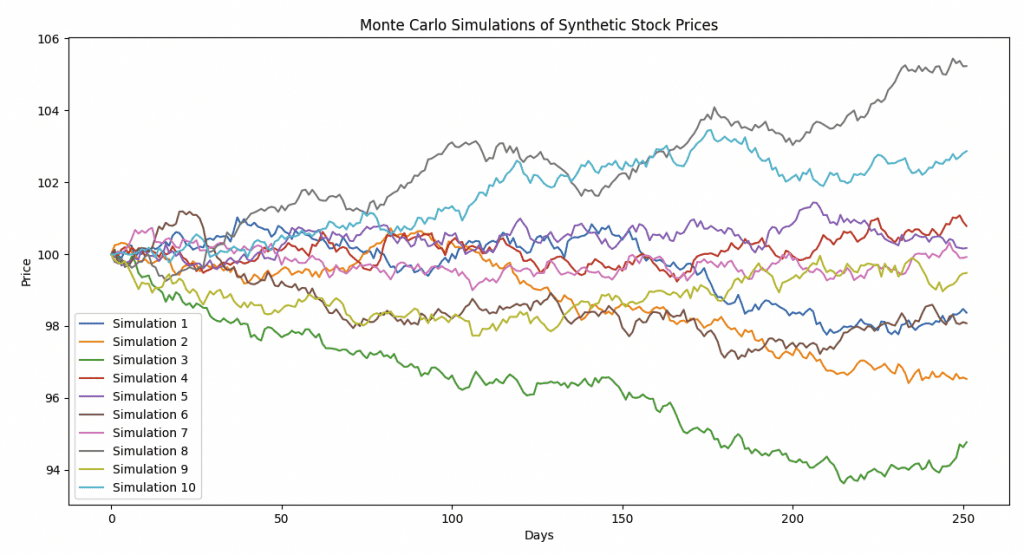
# Plot the first 10 simulations
plt.figure(figsize=(14, 7))
for i in range(10):
plt.plot(synthetic_prices.iloc[:, i], label=f'Simulation {i+1}')
plt.title('Monte Carlo Simulations of Synthetic Stock Prices')
plt.xlabel('Days')
plt.ylabel('Price')
plt.legend()
plt.show()
Example of Synthetic Data with Periodic Stress Events Coded In
In this article, we mentioned how synthetic data can be essential for understanding how an asset might behave during rare stress events.
import numpy as np
import pandas as pd
import matplotlib.pyplot as plt
def simulate_stress_event(event, prices, day):
"""
Applies the impact of a specific stress event to the stock prices.
Parameters:
event (str): The name of the stress event.
prices (ndarray): The array of stock prices.
day (int): The day on which the stress event occurs.
Returns:
ndarray: The modified stock prices after the event.
"""
ifevent=='Recessions':
impact=np.random.uniform(-0.2, -0.1)
elifevent=='Stagflation':
impact=np.random.uniform(-0.15, -0.05)
elifevent=='Market crashes':
impact=np.random.uniform(-0.3, -0.2)
elifevent=='Interest rate shocks':
impact=np.random.uniform(-0.1, -0.05)
elifevent=='Currency fluctuations':
impact=np.random.uniform(-0.05, 0.05)
elifevent=='Severe debt crises':
impact=np.random.uniform(-0.25, -0.15)
impact=np.random.uniform(-0.2, -0.1)
elifevent=='Natural disasters':
impact=np.random.uniform(-0.1, -0.05)
elifevent=='Wars and geopolitical conflicts':
impact=np.random.uniform(-0.2, -0.1)
elifevent=='Hyperinflation':
impact=np.random.uniform(-0.15, -0.05)
elifevent=='Political extremism':
impact=np.random.uniform(-0.1, -0.05)
elifevent=='Extreme commodity shortages':
impact=np.random.uniform(-0.2, -0.1)
elifevent=='Currency collapses':
impact=np.random.uniform(-0.3, -0.2)
elifevent=='Growth collapses':
impact=np.random.uniform(-0.2, -0.1)
elifevent=='Extreme unemployment scenarios':
impact=np.random.uniform(-0.15, -0.05)
else:
impact=0
prices[day:] *= (1+impact)
returnprices
def generate_synthetic_data_with_stress_events(initial_price, mu, sigma, days, num_simulations, events):
"""
Generates synthetic stock prices with periodic stress events using Monte Carlo simulation.
Parameters:
initial_price (float): The initial stock price.
mu (float): The expected return (mean).
sigma (float): The volatility (standard deviation).
days (int): The number of days to simulate.
num_simulations (int): The number of simulations to run.
events (list): List of stress events to simulate periodically.
Returns:
DataFrame: A DataFrame with simulated stock prices.
"""
dt=1/252# daily time step assuming 252 trading days in a year
prices=np.zeros((days, num_simulations))
prices[0] =initial_price
fortinrange(1, days):
random_shocks=np.random.normal(mu*dt, sigma*np.sqrt(dt), num_simulations)
prices[t] =prices[t-1] * (1+random_shocks)
ift% (days//len(events)) ==0:
event=np.random.choice(events)
prices=simulate_stress_event(event, prices, t)
returnpd.DataFrame(prices)
# Parameters
initial_price = 100
mu = 0.0001 # daily expected return
sigma = 0.02 # daily volatility
days = 50400 # 200 years of trading days
num_simulations = 10
events = ['Recessions', 'Stagflation', 'Market crashes', 'Interest rate shocks',
'Currency fluctuations', 'Severe debt crises'
'Natural disasters', 'Wars and geopolitical conflicts', 'Hyperinflation',
'Political extremism', 'Extreme commodity shortages', 'Currency collapses',
'Growth collapses', 'Extreme unemployment scenarios']
# Generate synthetic data with stress events
synthetic_prices_with_stress = generate_synthetic_data_with_stress_events(initial_price, mu, sigma, days, num_simulations, events)
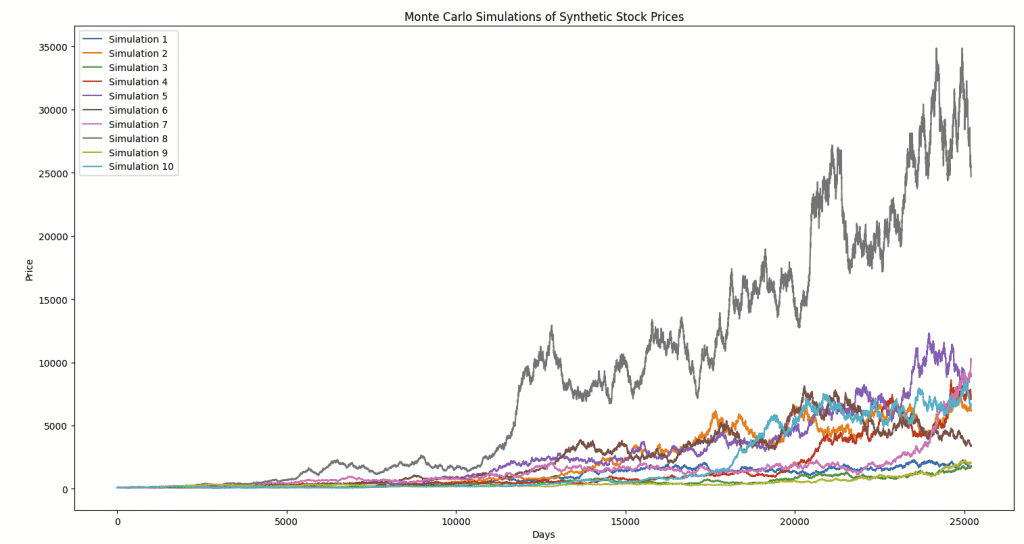
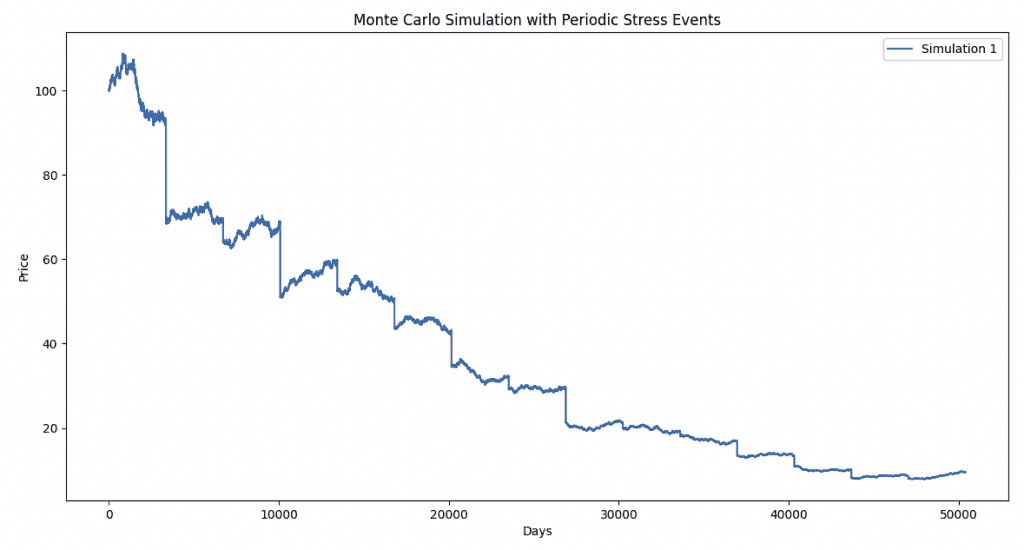
# Plot the first simulation
plt.figure(figsize=(14, 7))
plt.plot(synthetic_prices_with_stress.iloc[:, 0], label='Simulation 1')
plt.title('Monte Carlo Simulation with Periodic Stress Events')
plt.xlabel('Days')
plt.ylabel('Price')
plt.legend()
plt.show()
Here we can see the various episodic stress events over time and how those can damage the price of an asset.
Below, the code is reworked to include more positive return bias and more structural volatility to the asset.
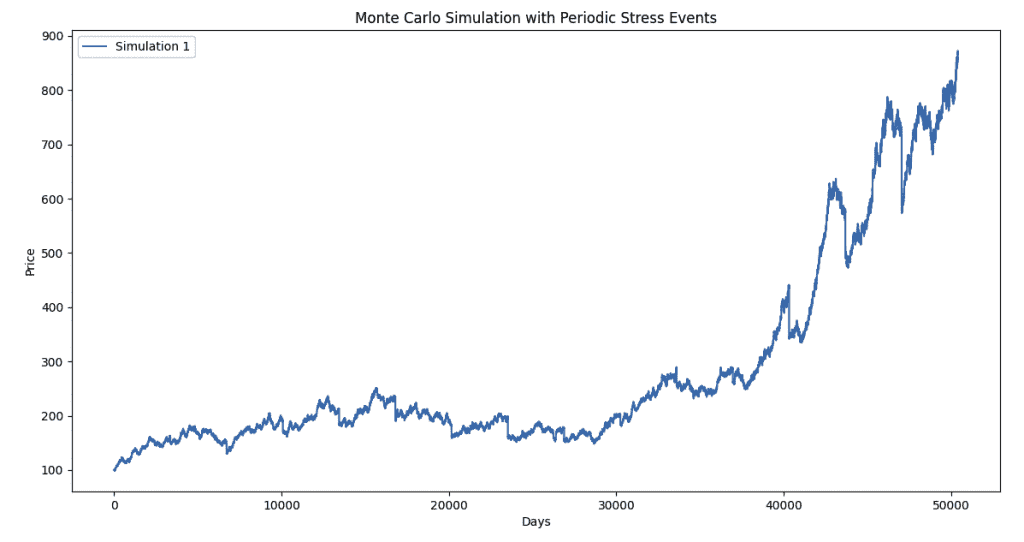
The stress events still affect the asset, but the chart looks more normal.
Conclusion
Synthetic data enables more thorough stress testing, risk management, and strategy development.
By complementing traditional backtesting and live testing methods, synthetic data allows for the exploration of a wide variety of market scenarios, including extreme and rare events that may not be adequately represented in historical data.
The importance of sophisticated stress testing procedures will only grow over time.
Synthetic data provides a flexible means to prepare for an uncertain future, helping traders and portfolio managers build more resilient strategies and better manage risk.
However, the use of synthetic data also comes with challenges, including data quality and managing model risk.
The potential applications of synthetic data in finance will continue to expand as techniques in machine learning and alternative data integration advance.
Ultimately, the successful use of synthetic data in portfolio stress testing and beyond requires a combination of technical expertise and domain knowledge.
By using synthetic data, financial professionals can gain better insights into potential risks and opportunities and how to build more resilient portfolios over time.