10+ Recession Indicators


Recession indicators are economic metrics and market signals that economists, policymakers, traders, and investors use to assess the likelihood of an economic downturn.
These indicators are sometimes categorized into two main groups:
- those that suggest a recession may start within the next year, and
- those that indicate an economy is already in a recession
These indicators are used by businesses, investors/traders, and policymakers to make informed decisions in their line of work and prepare for potential economic challenges.
No single indicator is foolproof, but a combination of signals can provide a more accurate picture of economic health and potential risks.
Key Takeaways – Recession Indicators
- No single indicator is foolproof – Use a combination of signals for a more accurate economic picture.
- Yield curve inversion (10y-2y) is a closely watched predictor historically.
- PMI below 50, especially in manufacturing, can signal broader economic weakness. However, its impact varies by country.
- Global interconnectedness means international indicators matter.
- Economic conditions in one region can affect others through trade, capital flows, and financial markets.
- Some indicators are considered leading (e.g., financial market happenings) while others are lagging (e.g., employment).
Dashboard of Indicators
No one indicator is perfect, so data and indicators have to be triangulated to best understand what’s going on.
For example, Haver Analytics and Goldman Sachs research give a type of dashboard of recession indicators:
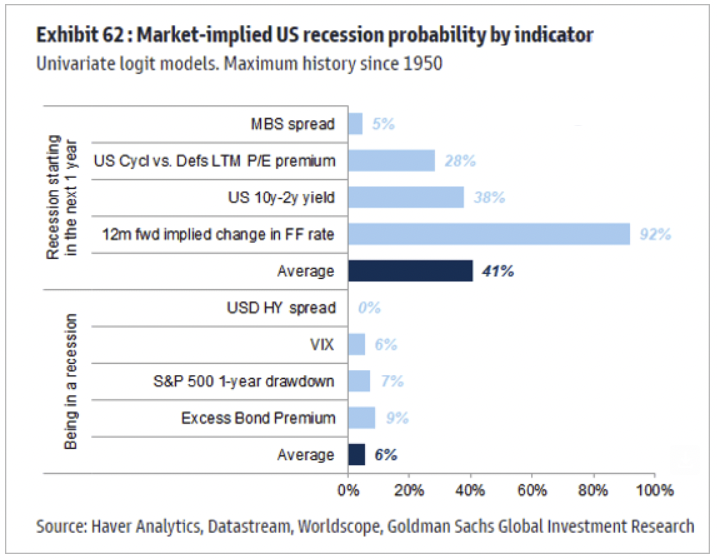
The mix of indicators at this particular reading presents a somewhat mixed picture, with some suggesting increased recession risk (particularly the implied change in the Federal Funds Rate) while others indicate relative stability.
This shows the importance of continuous monitoring and analysis of economic conditions.
Let’s go through them one by one.
The following are commonly used indicators for being in recession within the next year:
MBS Spread
The Mortgage-Backed Securities (MBS) spread is the difference between the yield on mortgage-backed securities and the yield on Treasury securities of similar maturity.
How it works
- A widening spread indicates increased perceived risk in the mortgage market.
- This can signal potential stress in the housing sector, which is a significant component of the economy.
- The importance of the MBS spread depends on the economy – e.g., more important in China than in Germany where home ownership affects more people in the former.
US Cyclical vs. Defensive LTM P/E Premium
This indicator compares the price-to-earnings (P/E) ratios of cyclical stocks to defensive stocks over the last twelve months (LTM).
How it works
- Cyclical stocks are more sensitive to economic cycles.
- Defensive stocks tend to perform more consistently regardless of economic conditions.
- A shrinking premium for cyclical stocks can indicate that traders are becoming more cautious about economic prospects.
US 10y-2y Yield
The yield curve, particularly the spread between 10-year and 2-year Treasury yields, is one of the most closely watched recession indicators.
How it works
- An inverted yield curve (when short-term rates are higher than long-term rates) has historically preceded recessions.
- It reflects market expectations of future economic conditions and monetary policy.
- Rates roughly reflect nominal growth rates or at least the trend.
- As such a declining forward path of interest rates suggests a slowing nominal growth trend. Whether this ends up in a recession depends on the level to which it falls.
- (The technical definition of a recession is two consecutive quarters of below-0% real GDP growth.)
- Market pricing simply reflects the mean dollar-weighted opinion.
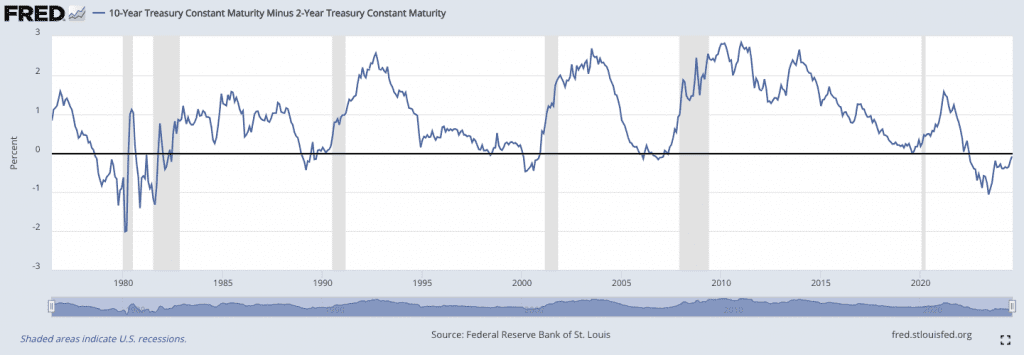
A chart of the 10/2 yield can be found below, showing its relatively high degree of historical accuracy in predicting a recession that has embedded it as a popular favorite:
12m Forward Implied Change in Federal Funds Rate
This indicator looks at market expectations for changes in the Federal Reserve’s benchmark interest rate over the next 12 months.
How it works
- It reflects market expectations of future monetary policy.
- Expectations of significant rate cuts can indicate concerns about economic growth.
The following are commonly used indicators for being in recession.
USD HY Spread
The high-yield (HY) bond spread measures the difference in yield between below-investment-grade corporate bonds and Treasury securities.
How it works
- Widening spreads indicate increased perceived risk in corporate debt markets.
- During recessions, this spread typically widens significantly as traders demand higher returns for riskier assets.
VIX
The CBOE Volatility Index, or VIX, is often referred to as the “fear index” and measures expected stock market volatility.
How it works
- Higher VIX levels indicate greater market uncertainty and fear.
- During recessions, the VIX typically spikes as traders become more risk-averse.
- VIX spikes often accompany stock market sell-offs.
S&P 500 1-Year Drawdown
This indicator measures the maximum decline in the S&P 500 index over the past year.
How it works
- Significant drawdowns often accompany or precede recessions.
- It reflects overall market sentiment and economic expectations.
Excess Bond Premium
The Excess Bond Premium (EBP) measures the difference between corporate bond yields and the expected default risk of the issuer.
How it works
- A rising EBP indicates increased risk aversion in credit markets.
- It can signal tightening financial conditions, which often precede or accompany recessions.
Let’s look at several other metrics are worth considering when assessing the likelihood of a recession.
Unemployment Rate and Initial Jobless Claims
The labor market is an important component of economic health.
How it works
- Rising unemployment rates and increasing initial jobless claims often precede or accompany recessions.
- A sudden spike in jobless claims can be an early warning sign of economic trouble.
Why the job market is considered a lagging indicator of recession
The unemployment rate is typically a lagging indicator of a recession because it reflects the economic downturn after it has already occurred.
During a recession, businesses experience declining revenues, leading them to reduce costs, often through layoffs.
However, these decisions take time as companies initially attempt to weather the downturn by cutting other expenses.
As a result, significant increases in unemployment generally occur after the recession is well underway or even after it has officially ended.
Accordingly, the unemployment rate tends to rise only after the broader economic decline has already impacted other sectors.
But there are still rare exceptions.
What we just said tends to hold during a credit-driven recession, but other types of recessions may be different, such as the COVID-related downturn in 2020 where employment spiked immediately.
Consumer Confidence Index
Consumer spending drives a significant portion of economic activity in many countries.
How it works
- Declining consumer confidence can lead to reduced spending and economic contraction.
Purchasing Managers’ Index (PMI)
The PMI is a survey-based indicator that provides insights into the health of the manufacturing and services sectors.
How it works
- A PMI reading below 50 indicates contraction in the sector.
- Persistent readings below 50, especially in manufacturing, can signal broader economic weakness.
- May not reflect the broader economy.
- Some economies are more manufacturing-intensive than others.
- A lower manufacturing PMI may affect China or Vietnam more than Luxembourg or Australia, for example, which are more serviced-based.
Most Manufacturing-Intensive Economies
- China – Manufacturing accounts for approximately 27-30% of China’s GDP, making it the largest manufacturing economy in the world.
- South Korea – Manufacturing constitutes around 25-30% of South Korea’s GDP, driven by industries like electronics, automobiles, and shipbuilding.
- Germany – Makes up about 20-25% of Germany’s GDP, with a strong emphasis on automotive, machinery, and chemical industries.
- Japan – Represents around 19-23% of Japan’s GDP, with key sectors including electronics, automobiles, and robotics.
- Vietnam – Accounts for about 16-20% of Vietnam’s GDP, with significant growth in textiles, electronics, and machinery.
Least Manufacturing-Intensive Economies
- Luxembourg – Manufacturing contributes only around 5-7% of GDP, with the economy being heavily service-oriented, particularly in finance.
- Greece – Manufacturing accounts for about 10-12% of GDP, with a stronger focus on tourism, shipping, and services.
- Iceland – Manufacturing makes up approximately 10-12% of GDP, with a greater emphasis on fishing and services like tourism.
- Australia – Manufacturing constitutes around 6-8% of GDP, with the economy primarily driven by services, mining, and agriculture.
- New Zealand – Manufacturing accounts for roughly 10-12% of GDP, with a significant focus on agriculture, forestry, and services.
Leading Economic Index (LEI)
The Conference Board’s Leading Economic Index is a composite of several economic indicators designed to signal peaks and troughs in the business cycle.
This mishmash of various indicators can make it more representative of a wider swath of economic activity.
How it works
- A declining LEI over several months can indicate an increased likelihood of a recession.
- It incorporates various components, including manufacturing activity, stock prices, and consumer expectations.
Corporate Profits
Corporate profit margins and overall profit levels can provide insights into business health and potential future investment and hiring decisions.
How it works
- Declining corporate profits can lead to reduced business investment and hiring, potentially triggering a recession.
- This indicator can be a lagging one, as companies may take time to adjust to changing economic conditions.
Housing Starts and Building Permits
The housing sector is often a leading indicator of economic activity.
How it works
- Declining housing starts and building permits can signal weakening economic conditions.
- Housing activity has significant ripple effects throughout the economy.
- Affects everything from construction jobs to furniture sales.
Interpreting Recession Indicators
It’s important to consider them collectively and in context.
Economic conditions are complex and multifaceted, and no single indicator can provide a complete picture.
There are lots of interdependencies and things dependent on other things.
Weighting and Combining Indicators
Different analysts and institutions may assign varying weights to different indicators based on their historical accuracy and their understanding of current economic conditions.
The indicators mentioned earlier in the image with specific percentages come from a particular model and analysis framework.
False Signals and Lag Times
Recession indicators can sometimes produce false signals or have significant lag times.
For example, some often say that, e.g., the stock market or yield curve has predicted “nine out of the last five recessions,” illustrating that market drawdowns don’t always coincide with economic recessions.
Global Interconnectedness
It’s also important to consider international indicators and how economic conditions in one country or region can affect others.
Economies are linked together via trade, investment/capital flows, and financial markets.
Goods, services, and capital flow across borders, creating interdependencies.
Global supply chains connect industries, while foreign direct investment fosters international business ties.
Exchange rates and financial markets help synchronize economic conditions, with economic policies and events in one country impacting others through these interconnected channels.
Conclusion
Recession indicators help guage economic health and potential risks.
Nonetheless, economic forecasting is an imperfect science given the large range of unknowns and variance in an enormous number of variables.
Forecasts are probabilistic only until actual data can be measured.
Policymakers, businesses, and traders/investors should use these indicators as part of a broader analytical framework, considering multiple data points and qualitative factors when making decisions.
As economies evolve, new indicators will emerge and the relative importance of existing ones may shift.