Can an Oil Shock Cause a Recession?

On September 14, 2019 drones attacked state-owned Saudi Aramco oil processing facilities at Khurais and Abqaiq. The initial size of the shock was huge. Global oil production is slightly over 100 million barrels per day. The attack on Saudi oil infrastructure was worth some 5.7 million barrels per day of production, meaning 5 to 6 percent of all global supply was temporarily taken out.
It was the largest single disruption on record in percentage terms. In absolute terms, it was only slightly smaller than the disruption associated with Iraq’s invasion of Kuwait in the early 1990s.
In the past, oil shocks were common causes of recessions, not just in emerging market economies but in developed markets as well. The 1973 oil shock sent the US into a recession with its dependence on Mideast oil. The incident corresponded with US equity markets losing 45 percent from October 1972 to September 1974 (not all due to an oil shock).
The mid-September attack resulted in Brent crude oil soaring nearly 20 percent in the immediate aftermath before retracing all of that move back. In the past, these surges in oil (e.g., January 1991) were more structural. In this case, because the damage was caused to an above-ground facility rather than an oil field the recovery timeline was much quicker. Saudi guidance confirmed that the recovery would take only weeks.
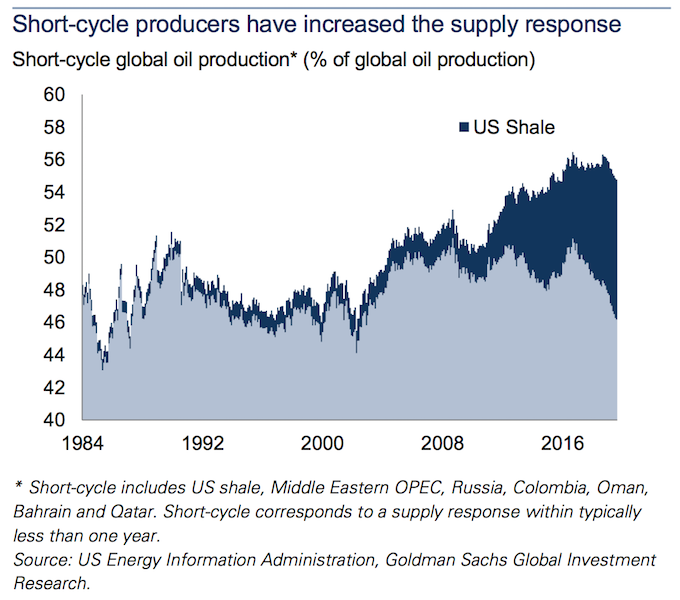
Moreover, oil inventory was ample and short-cycle shale producers have the capacity to turn production on and off quickly to fill gaps in supply and demand. Production can be ramped up and down within months. As a result, the market is much better positioned than it’s been in the past to deal with a shock of 5-6 percent of the world’s global oil supply being disrupted.
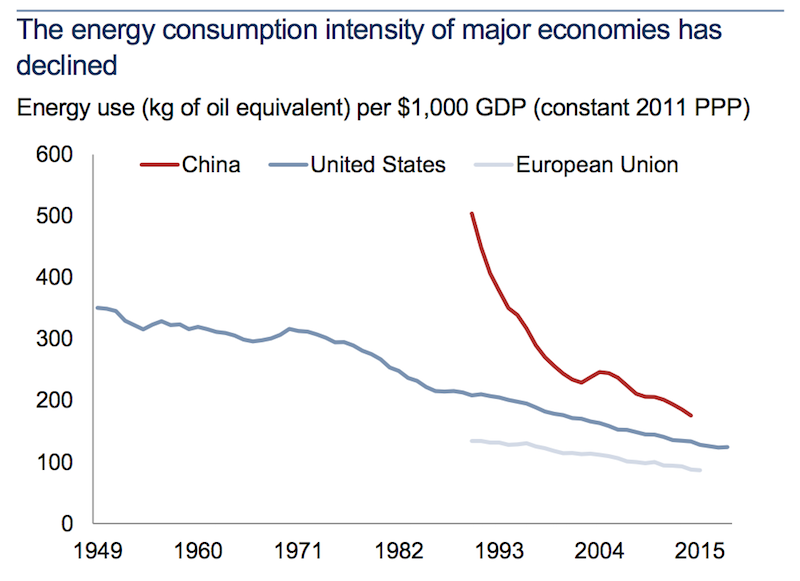
Major developed markets are also less energy intensive in relation to GDP as they were in prior decades.
Oil’s drag on growth typically functions via the feed through into higher corporate and household expenses. Higher energy prices increase corporate costs. Households also have to pay more in various ways and might see inflation. Higher energy expenses crowd out other forms of spending.
However, with lower energy intensity today than in the past, a 10 percent rise in oil prices may be just a 0.1 percent drag on developed market growth. This compares to a 0.5 percent drag prior to 2008.
Goldman Sachs economists estimate that a $10 per barrel increase in oil lowers US GDP from consumption by around 0.15 percent (i.e., roughly $30 million less in overall consumption), though energy capital expenditures contribute 0.12 percent positively to GDP. This leaves the net effect relatively muted.
Nonetheless, Saudi Arabia still remains one of the largest individual oil processing and producing assets in the world. The attacks also showed that it’s more susceptible to external attacks than most expected.
What prompted the event?
The US has sanctions on Iran due to its illicit nuclear and ballistic activities.
Iran’s economy is heavily dependent on its oil exports. Part of the US sanctions prevent Iran from exporting its oil. Out of frustration of that reality, Iran, it is strongly believed, decided to act out by attacking the oil infrastructure of a US ally. Or alternatively they provided the weapons and machinery to help bring out the attack to whoever did. So, they’re highly believed to be “guilty” either way.
Iran’s oil dependency also makes a higher oil price more desirable, increasing the value of the country’s most valuable single economic resource. Carrying out attacks to disrupt a major power’s oil infrastructure can help achieve that aim. The end goal is to exit sanctions that isolate Iran economically and politically and help re-integrate itself into the global economy.
Iran is showing that it has some power of its own to inflict damage and is using a form of leverage (including internal nuclear development) to get the US back to negotiating an agreement. At the same time, Iran can at least pretend that it didn’t carry them out given the obscure nature of the attacks, which can help to avoid retaliatory attacks from the US or its allies.
US sanctions have left the Iranian economy in a deep recession and high-double-digit inflation. The current sanctions are tougher than the set of embargos that were implemented pre-2014 (that brought Iran to negotiate and formalize the Iranian nuclear agreement (JCPOA) in 2015). Unlike back then, oil exports are now banned.
Could the US squeeze Iran further?
The only additional area that could be feasible is to implement secondary sanctions. These would prohibit any country from doing business with Iran. If they do, such countries could also find themselves banned from doing business with the US.
But additional sanctions would only impact Iran marginally given its goods and services exports to non-US countries is relatively small in relation to its oil exportation and other business with the US under non-sanctioned circumstances.
That the US didn’t respond more forcefully – i.e., by targeting the sites involved in supplying or launching the drones and other attack weaponry – signals to Iran that its actions can come without repercussions.
Will Iran feel emboldened to carry out more attacks, not only from Iran but from countries whose interests are also at odds with those of the US?
Do the Saudis and Israelis still have the same level of confidence that the US will act as a guarantor of their security and interests in the future? Or will they both have to do more of their own bidding in the future?
The attack also won’t paint Saudi Arabia in the best light as a country where investors can invest their capital. Saudi Arabia clearly has issues protecting its most critical assets, and the US may no longer be as reliable of a partner to protect its interests and retaliate against such attacks. Even though the Trump administration is hawkish as a whole on Iran, it is clearly reluctant to engage with Iran militarily or keep a large military presence in the Mideast.
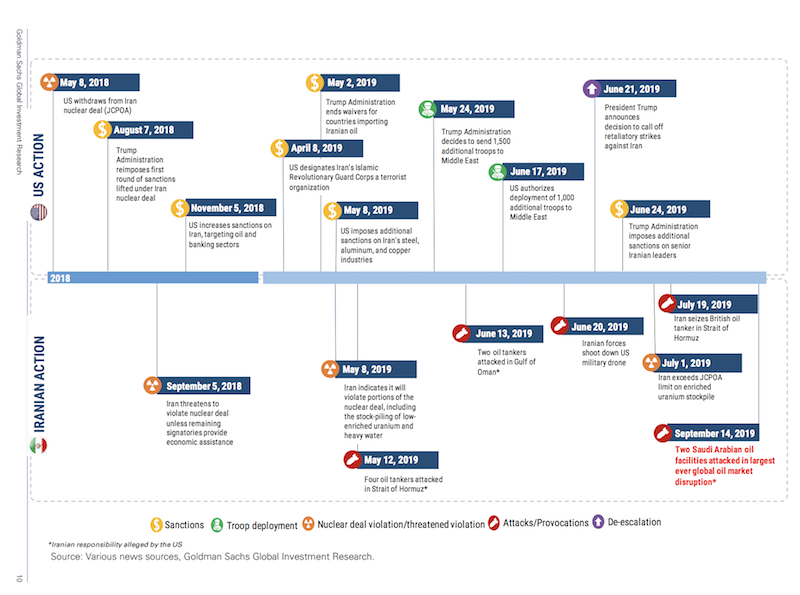
Below is a timeline of US-Iran tensions since the US withdrawal from the Iranian nuclear agreement on May 8, 2018:
Oil’s impact on developed market core inflation
Using the stress test of a 10 percent rise in oil prices, the impact on core inflation in developed markets is much less than it used to be. A 10 percent increase is now estimated to have less than a 0.1 percent effect on core inflation in the US and less than 0.2 percent in the euro area. This stood at about one percent for most of the 1980s and 1990s.
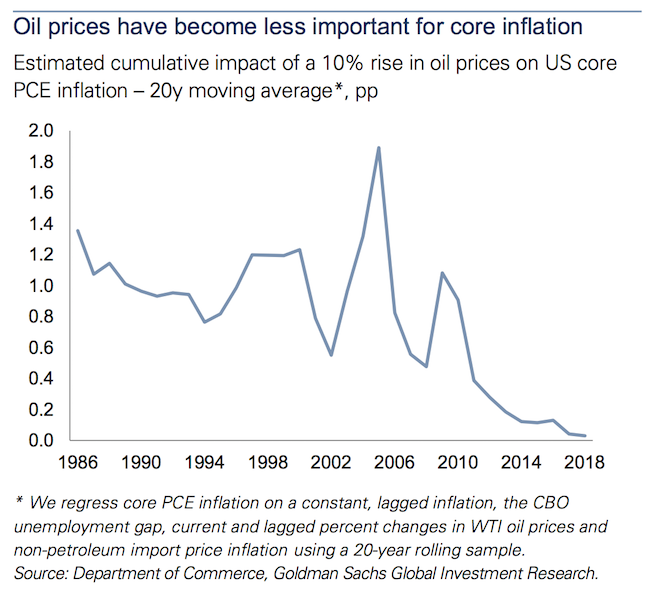
Oil price fluctuations no longer have the same effect on developed market growth or inflation. Energy share as a portion of personal consumption was 10 percent in the early 1980s, but has fallen to 4 percent today. Energy intensity of developed market GDP has declined substantially. This is also especially true for China as well.
As the second diagram in this article shows, China, as recently as the early 1990s, used 500kg of oil equivalent for every $1,000 in GDP and is now at less than 200kg per $1,000 in output, which isn’t far off from the US and European Union as its output mix becomes more services oriented.
Lower volatility in inflation in today’s developed markets is also a consequence of greater flexibility in the supply response. US shale’s total market share has expanded to about 10 percent of the overall global oil market. Short-cycle production as a whole is now about 54 percent of overall global production.
Inflation expectations are also more anchored than they have been in the past. Developed market central banks typically want to anchor their inflation around 2 percent or a bit under.
Virtually all major G-10 central banks have some version of it.
– The US Federal Reserve targets price stability within the context of maximum employment.
– The European Central Bank targets inflation of just under 2%.
– The Swiss National Bank targets price stability.
– The Bank of Japan and Bank of England both target stability in prices and the financial system.
– Some central banks also include a mandate to keep the currency stable. The Bank of Canada, Reserve Bank of Australia, and Reserve Bank of New Zealand all follow stable currency mandates in part.
Inflation expectations also influence asset price return expectations. The financial system provides the money and credit into the real economy, which goes on to influence the prices of goods and services. The anchoring in inflation expectations in major developed markets helps to make oil price shocks more of a blip in the inflation radar rather than inducing a structural shift.
Goldman Sachs estimates of oil price increases on growth
Knowing the sensitivity of various regions to oil on both the growth and inflation front is important. These figures often feed into traders’ models, which in turn influences the “fair value” prices of other assets in real-time.
Global
A 10 percent supply-driven rise in crude oil would decrease global real (i.e., inflation-adjusted) GDP by around 0.25 percent. The largest impact would occur in the first few quarters after the shock.
US
A $10 per barrel rise would lower US GDP by about 0.03 percent in total (15bps from lower consumption, with 12bps in improvement from increased capital spending in the energy sector).
A $10 per barrel supply-side shock would boost core inflation by only an estimated 3-4bps.
Europe
Europe’s drop in GDP from a 10 percent rise in oil would be on par with global output at about 0.25 percent.
A persistent (rather than transitory) 10 percent rise in oil prices would add about 0.20 percent to euro area consumer inflation over one year.
Japan
A 10 percent rise in oil would lower Japan’s GDP by around 0.20 percent over a two-year span, with the bulk of the slowdown coming from the consumer channel.
The boost in inflation by that rise in price would approximate 0.30 percent.
Asia, excluding Japan
Often, Asia is analyzed excluding Japan because the financial characteristics of Japan are quite different from the rest of Asia.
Japan is a developed market. It is also a creditor country (its net foreign asset position, or net assets minus net liabilities, is positive).
Its currency is a safe haven flow. This is unlike most other Asian currencies, which are pro-cyclical.
Its capital markets are stable, being highly developed. Its equity market capitalization is on par with that of China, though China’s market is much more speculative and driven by retail investors, making its price action more momentum oriented. Japan’s bond market, with zero and negative rates, is characteristic of other developed markets. Japanese government bonds are among the most prized reserve assets globally behind US Treasuries and German bunds, and on par with UK gilts and French government bonds (“OATs”).
Asia ex-Japan would see a $10 rise in oil lower GDP by about 0.2 percentage points.
The effect would be uneven. The most sensitive oil economies include Taiwan, Thailand, the Philippines, and Korea. Indonesia and China would also be impacted, but less so.
A $10 rise would increase inflation by approximately 25bps. The largest price increases would be seen in Malaysia, the Philippines, Indonesia, and Thailand.
CEEMEA (Central and Eastern Europe, Middle East, and Africa)
With more developing markets, a rise in oil prices will typically have a more material impact on GDP levels. These markets tend to rely more on industrial production rather than high-value-add services or digital technologies like in most major markets.
A 10 percent rise in oil prices would reduce GDP in the broader CEEMEA area by 0.3 to 0.4 percent. It will also project to do so over a longer period, about 2-3 years, compared with quicker recovery times in developed markets (from months to up to two years).
The biggest drag would be in Hunary (0.45 percent), the Czech Republic (0.65 percent), and Turkey (0.80 percent). Russia, on the other hand, as an oil producer, would benefit from a 10 percent rise. Its GDP would be expected to increase by about one percentage point over that 2-3 year period.
Regional inflation would be more uniform in the event of a 10 percent rise. Depending on the country, it would expect to rise by 0.4 to 0.8 percentage points.
Latin America
A 10 percent rise in oil would cause a cumulative GDP increase in Mexico by about 11bps and 2bps in Brazil. Both countries are oil exporters in some form.
The increase in prices would increase inflation in Mexico by approximately 8bps and 7bps in Brazil. Mexico and Brazil would have more muted reactions than most other markets given that domestic energy regulations function similar to a peg. Fuel prices are largely controlled by the government and not as responsive to the movements in energy prices in the global markets.
Oil prices throughout time
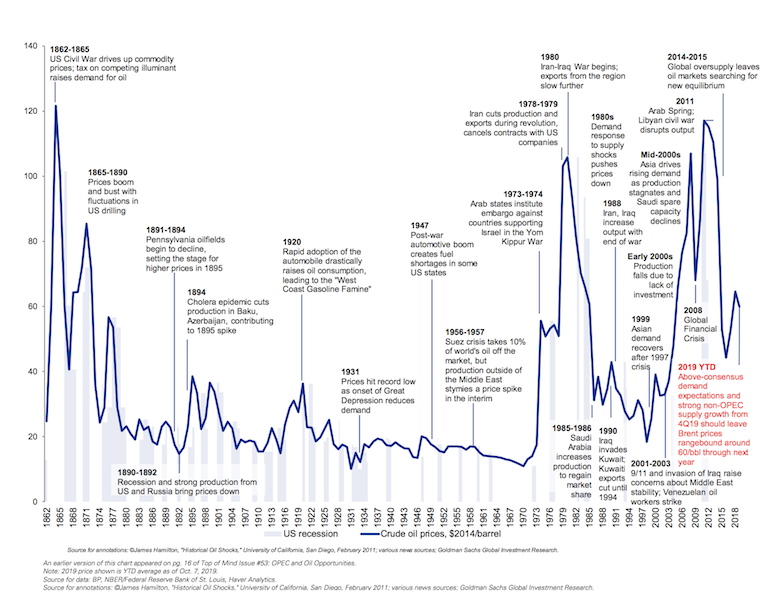
The chart below shows an annotated history of oil prices over the past ~160 years adjusted into 2014 US dollar terms.
Individual economy oil price sensitivities
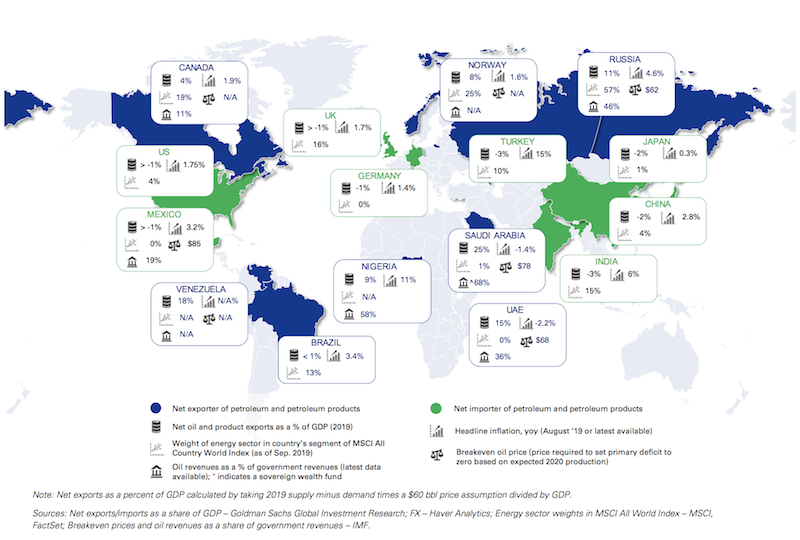
This chart below shows:
– whether a country is a net exporter or net importer of petroleum and petroleum products
– net oil and product exports as a percentage of 2019 GDP
– headline inflation (often termed CPI inflation)
– oil breakeven price needed to neutralize the country’s primary deficit, which is the fiscal deficit minus interest paid on borrowings of previous year (helps to determine whether the money a government spends is being used for productive purposes, or whether the debt to GDP ratio is going up due to poor spending behavior and/or insufficient revenue collection)
– weight of the country’s energy sector in the MSCI All World index as of September 2019
– oil revenues as a percentage of total government revenues
Are ‘energy independent’ markets safer places to invest?
The US is largely self-sustaining in meeting its energy production needs. However, it would still not be accurate to label the US as “energy independent” because there are certain types of oils that the US still needs its refineries to acquire. And these must from other countries.
The US economy is also tied to the rest of the world’s economy. The rest of the world is dependent on having access to energy resources.
Part of global energy trade can be thought of as a zero-sum. The section on the effect of individual economies sends a message, to an extent, that while most countries are hurt by a rise in oil prices, it’s good for a smaller number of them. One country paying more for oil is another country’s gain. But these risks can be balanced such that no one country should suffer financially based on what oil does. Naturally the (semi-) free market tends to set prices in a way that provides an appropriate level of supply relative to demand.
For many commodities, getting at the key driver that incentivizes production is important. When the sellers and producers in a market can’t sell their goods profitably, it dis-incentivizes production and supply becomes scarcer.
The cost of production is a big one, though different “breakeven points” have different influence.
For example, with respect to the oil market specifically, for Saudi Arabia – a large producer with large influence over the market – the cost of production for a barrel of oil is around $5 (WTI oil). But that doesn’t mean it’s the best economic decision to produce as much oil as possible.
Saudi Arabia’s breakeven with respect to its budget (where it has neither a surplus nor a deficit) is around $73. But that’s also not quite as important because governments can run a deficit if necessary for long periods. They simply need to sell debt, which can be done to a point and for each country it is different. (Countries with reserve currencies can sell more debt to the rest of the world than countries that have higher risks.)
Saudi Arabia’s balance of payments breakeven WTI oil price is approximately $55. The balance of payments breakeven is the most important of the three because it has the biggest impact on global capital flows.
Oil in the $40s for any extended duration requires Saudi Arabia to burn through reserves. The combination of Saudi Arabia and OPEC production cuts in recent years and tightened oil capex makes sub-$40 oil unlikely for long periods of time because of how uneconomical it is.
Moreover, the events of the Middle East are not only important at a local level. There are issues pertaining to its status as a hub of global terrorism. There are issues relating to illicit terrorism and ballistic activities. The US has interest in the region with its allies in Saudi Arabia and Israel (a non-oil exporter).
Because of political, social, and economic instability in the region, there are often mass movements of people. Given Europe’s relative proximity, refugees often flow into the euro area or seek protection within more stable developed markets. The lack of stability on various fronts in the Mideast tends to spillover in various ways, including into financial markets depending on the resultant financial flows that manifest.
The major powers of the world also butt up against each other in the Mideast – the US (world’s largest economy, co-largest nuclear power, top reserve currency), China (second-largest economy, emerging power that’s the next to challenge the US in economic, military, and technological supremacy), and Russia (co-largest nuclear power).
China has interests pertaining mostly to oil (as an importer) and trade expansion. But China’s involvement in the Mideast is not extensive, and they have heavier focus on issues such as Hong Kong (i.e., access to a prime global financial hub), its involvement in the South China Sea, and its relationship with Taiwan.
Russia is playing a role in Syria, mostly to support the regime of al-Assad. The US is not as heavily involved militarily under the Trump administration, not unlike the Obama administration, which pulled back after the Bush administration’s heavy involvement in Iraq and Afghanistan.
The US is now engaged in sanctions against Iran to squeeze its economy. The end goal isn’t entirely clear, whether that’s seeing sufficient evidence that Iran is no longer engaged in the development of nuclear arms and missile delivery systems, regime change, a new nuclear agreement, or new forms of policy change. The Trump administration is clearly not interested in military confrontation despite Iran’s testing – for example, we’ve seen the attacks on Saudi oil facilities (strongly believed to be from Iran), Iran’s shooting down of a US drone, attacks on tankers in the Strait of Hormuz, and the seizure of foreign tankers. Diplomacy hasn’t been much of a factor.
If a Democratic candidate were to beat Trump in the 2020 presidential election, the outlook wouldn’t look significantly different. There would be more interest in returning to a nuclear agreement with Iran. But there was no long-term structure associated with the 2015 agreement, as it’s set to expire in either 2025 or 2030. Many Democratic candidates are also in favor of pulling troops out of Syria, Afghanistan, and/or Iraq. So, US foreign policy is likely to remain less committed to the region regardless of who wins the 2020 election.
Will this influence Saudi Arabia to lose confidence in its dependence on the US for military support?
The US has not shown interest in retaliating against Iran for the oil facility attacks. The US may be less of a partner for Saudi Arabia going forward. We’ve seen some economic cooperation between the Saudis and China. This gives the chance for China to begin spreading its currency globally and to buildup its reserve status. We’ve also seen the Saudis cooperate with Russia on oil production. In the absence of a stronger US presence, other militias and paramilitary groups are working to fill the void (e.g., Hezbollah, individual governments).
When we look at all the tensions in the region – the Israel-Palestine relationship, the confrontation between the Kurds and Turkish forces in Syria, a deteriorating situation in Libya, instability in Iraq and Egypt, conflict between India and Pakistan, or even Russia’s broader tensions with Europe – there are really no parts of the region that show the prospect of positive long-term development.
Is the US – or other major powers – even capable of mediating these problems? Or is the best response to stay more hands off at the expense of seeing alliances fray and try to best insulate US interests from whatever happens?
How should markets interpret Mideast risks?
Markets will tend to under-weigh geopolitical risks because they are difficult to quantify and flare up rarely.
It is hard, for example, to ascertain how much a risk premium one should embed in the S&P 500 over Mideast terrorism concerns or refugee flows out of Europe, or the nuclear and ballistic threat from Iran, or risks to Saudi energy supply, and so on.
Logically we know that the region’s instability shouldn’t be weighed at zero, but traders aren’t going to peg it very high either. At least not in relation to more immediate concerns such as earnings, domestic interest rate policy, and a trade conflict between the world’s two largest economies.
In financial markets there are always things to worry about. Some things are impossible to have control over so it’s best not to have exposure to them. One probably can’t predict when geopolitical, trade, or other tensions might flare up, so it’s important to have balance in a portfolio. If you’re very concentrated in stocks, owning safe bonds and small amounts of risk haven assets (e.g., gold, yen, Swiss francs) can help protect your portfolio against those risks.
The premiums associated with geopolitical risks are different between different companies.
Corporations that inherently have shorter development cycles – e.g., services, software, digital technologies – don’t need to worry about geopolitical risks impacting their businesses in the same way companies focused on long-cycle production do. This includes companies that are capital-intensive and deal in durable goods like machinery, vehicles, and manufacturing. In some respects, a company like Caterpillar, Ford or GM is going have risks associated with it that a firm like Microsoft or Apple doesn’t.
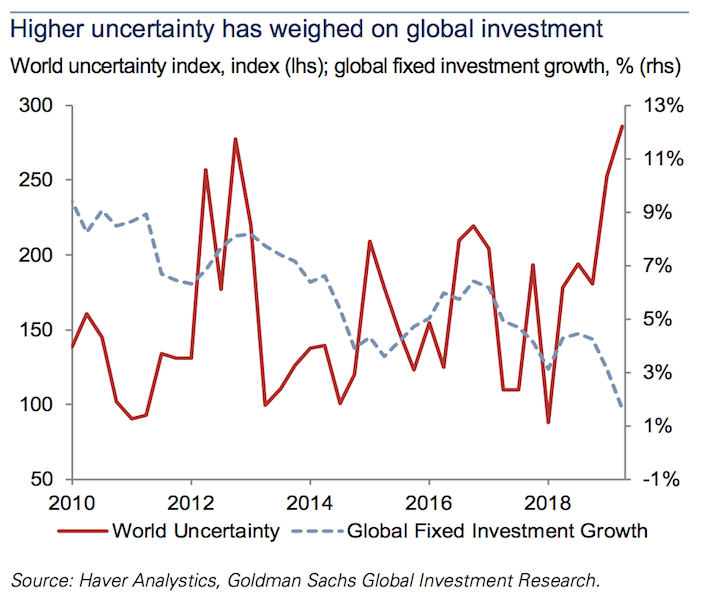
Moreover, the quantity of long-cycle investment is larger than that of short-cycle investment. That means increasing geopolitical risks – US-China trade, all the Mideast matters discussed, and so on – have a material impact on overall total global investment.
Below we can see the relationship between one interpretation of global uncertainty on global fixed investment growth:
The US, South Korea, and Germany are all economies that have traditionally been dependent on capital-intensive, long-cycle manufactured goods. And because manufacturing is a bigger piece of emerging economies than it is developed economies, geopolitical risks will tend to have a larger impact on developing economies.
For example, when US-China trade tensions flare, you typically see a bigger impact in emerging market equity indices than you do the S&P 500 or NASDAQ, which have a higher proportion of services and tech based companies in developed economies.
How to position against these risks?
Positioning against known geopolitical and “other” risks is not easy in itself.
The list of knowns is always quite large – e.g., China’s rise, corporate profit declines, currency devaluations, trade-related volatility, dollar scarcity, Argentina, Turkey, Venezuela, hard Brexit, Hong Kong, Italian banks, Kashmir, North Korea, South China Sea, Mideast.
But “unknown” risks – a 9/11, Saudi oil facility attacks – are very difficult to position against. These events are rare, though they can drive rapid changes in volatility and asset prices. Moreover, hedging these tail risks is often very expensive to do. Given the inability to time these events, tail risk hedges typically lose money for elongated periods.
Also, these shocks tend to impact specific asset classes. The Saudi oil facility attacks were a big event for Brent crude oil, but not so much for the S&P 500.
Traders that stay well-diversified and balanced across multiple asset classes will tend to ignore tail risk and assume the structure of their portfolio will be able to handle whatever effect occurs. Naturally, in the current environment, there are more immediate things to worry about, like weaker economic growth, central banks running out of traditional policy room, and trade conflict rumors/news.
Yet, as markets have become more electronic, more intertwined, and more global, with correlations tightening in many respects, geopolitical tail risk can have implications for the forward trajectory of growth, inflation, and broader risk sentiment.
As growth weakens and central banks become more impotent in terms of the traditional policy arsenal, markets are in some ways more vulnerable to these geopolitical shocks.
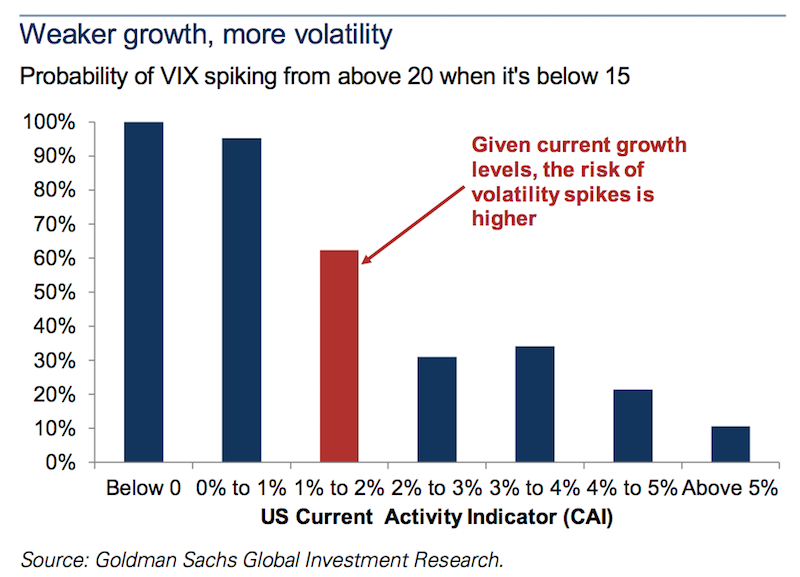
Over the past 1-2 years, traders’ growth expectations have lowered.
This is showing up in lower forward earnings expectations in equities, lower bond yields (a function of nominal growth), a shift away from cyclical and value stocks (which rely more on growth) to non-cyclical and growth stocks (that rely less on growth), and more toward assets like gold, yen, Treasuries, and other cash assets.
2019 has been a good year to “buy everything” as expectations of easier monetary policy typically have a favorable impact on all financial assets, including gold.
Growth is still positive across most markets, so equities have responded positively, notching new all-time highs in the US. But with growth low and developed economies going into an elongated slump in growth, the prospect of a geopolitical shock having a greater-than-average impact on growth and asset classes is higher than normal.
While geopolitical shocks have perhaps a stronger influence on growth, their prospective influence on global inflation trends is more muted. The growth in short-cycle oil production, notably US shale, has made oil shocks less inflationary to the world than they have been historically. Shale allows supply to be more flexibly adjusted up and down as needed.
That said, inflation hedging is relatively cheap. There is little demand for inflation protection – e.g., the pricing of inflation-linked government bonds is low relative to the standard versions, or breakeven inflation instruments that can be purchased by institutional investors.
So broadly speaking, traders are not well prepared for a potential spike in inflation or interest rates.
Where is the key oil risk?
We do know that oil price changes and oil shocks will impact asset classes disproportionately. While the S&P 500 index held steady following the attacks, certain assets will perform well and some will perform poorly (outside of the obvious fluctuations in crude oil itself). These fluctuations generally have to do with the importance of oil prices on income.
For example, the Canadian dollar (CAD) and Russian ruble (RUB) are oil exporters and a positive rise in oil benefits them accordingly. When oil prices increase, this benefits national income, leading to greater attraction of their assets (i.e., cash, bonds, equities).
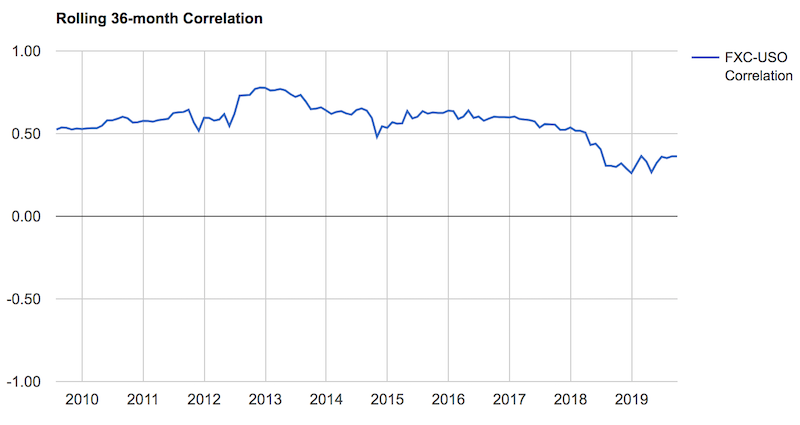
Below is the 36-month rolling correlations between the Canadian dollar and crude oil. We can see that it’s correlation has held at around 0.55 over time:
For a place like India, an oil importer, a spike in oil hurts their national income (more diverted to buying oil to meet internal energy needs). This makes their assets less attractive and the rupee (INR) declines in conjunction.
The mid-September oil shock had positive and negative effects on exporter and importer currencies, but the extent was limited.
Because of fundamental changes in the global crude oil market, as already discussed, long-run oil price expectations are more anchored than they have been in the past. Shale’s ability to fill supply gaps quickly is the most important reason. Accordingly, investors are less concerned about a supply disruption than they have been in the past.
After the attack on the Saudi oil facilities, we saw the spot price of crude oil change much more significantly than the longer-end of the curve. Oil is typically traded as futures. You can see what the market expects its price to be up to ten years in the future by looking at the futures curve.
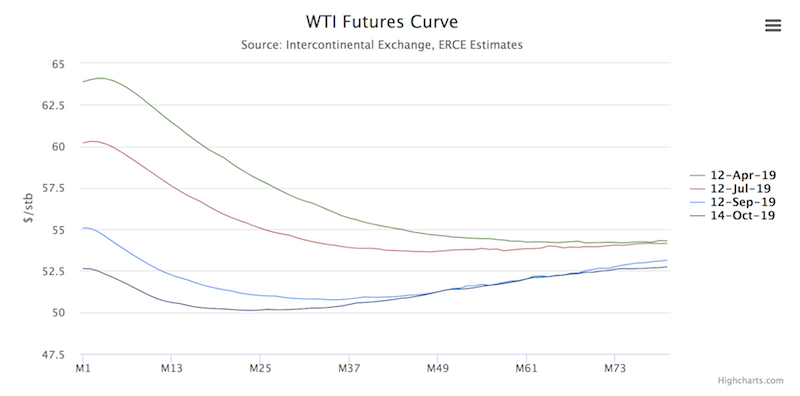
You can see how spot prices (the very front of the curve – i.e., M1), taken over this six-month range comparison, change much more (around $12) than those over the long end of the curve (about $2).
In other words, spot prices are much more volatile than those further out on the curve. The delta of the M12 contract (i.e., price for crude oil to be delivered 12 months out) might have a delta to spot of around 0.92. Namely, the M12 follows the spot price with some ~92 percent correlation.
However, the M80 contract (i.e., price for crude oil to be delivered 80 months out) might have a delta to spot of only 15 to 20 percent.
The impact of shale is doing a better job of anchoring long-run oil price expectations. US oil production is also an increasing share of overall global production, so oil shocks are having a relatively muted effect on the long-run as there is less feed-through into longer-term growth and inflation expectations. This also means less of an impact on global stock and bond markets.
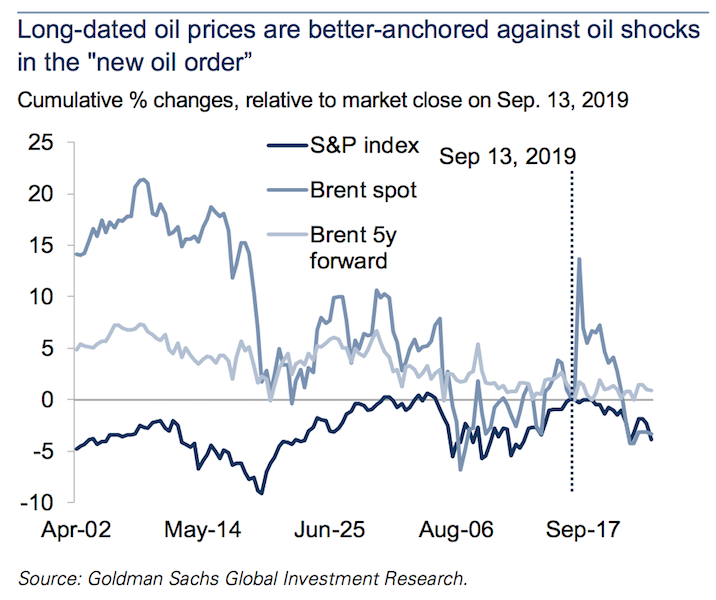
The chart below shows the influence of the September Saudi facility attacks on the spot price of Brent oil (relatively high) in comparison to Brent 5-year futures (muted) and the S&P 500 index (muted).
We also know that the Saudi attacks also didn’t lead to much of a structural change in geopolitical risk. Risk sentiment didn’t decrease further. Markets were reminded that these types of events could happen and that Saudi oil infrastructure is vulnerable, but that this is more one-off in nature and likely wouldn’t lead to a broader conflict in the region that would push risk assets lower.
While the spot price of Brent oil saw a 20 percent increase, the repricing of long-term geopolitical risk was immaterial given the negligible response by the S&P index.
The Saudis also provided a fast timeline for recovery given this wasn’t an attack on an oil field but rather storage and processing infrastructure. Even though the embargo on Iran’s oil was only about half of the Saudi oil that was taken out of production, the market knew that the effects of the loss of Iranian oil would be of a much longer duration and more impactful accordingly.
In the case of a trivial to zero rise in geopolitical risk in the event of an oil attack, “oil” and “non-oil” currencies would react in relation to the relative benefit or dis-benefit of oil prices on national income. Namely, the currencies of oil exporters would benefit and the currencies of oil imports would not benefit.
For example, being long the Colombian peso (COP) or Norwegian krone (NOK) relative to the US dollar might yield a modest benefit in the event of a loss to some of the world’s oil supply, while being short the Indian rupee (INR) relative to USD would effectively be some type of “short oil” position.
But in the event of a material rise in perceived geopolitical risk, the influence on “oil” and “non-oil” currencies changes.
For instance, the benefit of higher oil prices on the COP or RUB might be swamped by the increase in geopolitical risk and sell off against reserve currencies (USD, EUR). The INR would likely decrease by even more. The increase in the price of oil (imports more expensive) would exacerbate the effect on the rupee through the increase in geopolitical tensions.
How to protect against oil shocks that also reprice geopolitical risk?
The best way, in terms of foreign exchange trading, would be to go long oil-exporting currencies like RUB, MXN, and COP against funding currencies like the Korean won (KRW). The KRW is sensitive to both heightened geopolitical risk and higher oil.
A long position in RUB/KRW, MXN/KRW, and/or COP/KRW also has the benefit of being carry positive in addition to being a hedge against higher oil and a material long-run repricing of oil-related geopolitical risk. The Chilean peso (CLP) is also an option in lieu of or alongside the KRW as a funding currency.
The general point is that oil price shocks do not impact prices linearly. It depends on the nature of the shock and, importantly, whether the event should logically reprice long-run geopolitical risk more broadly.
Are oil prices efficient today?
At the time this article is being written, WTI oil is approximately $55 per barrel. Global economic growth was higher in 2018 than in 2019. This kept demand for oil higher in 2018 and demand wasn’t materially hit until oil reached about $80 per barrel. Oil declined precipitously in late-2018 due to excessive tightening of monetary policy (and future monetary policy expectations) in the US.
In the latter part of 2019, global growth is lower. So currently, it doesn’t take as large of an increase in oil before demand falls. In other words, the world is more sensitive to oil prices right now than it was in an environment where global growth was more robust.
When oil was $80 last year, this incentivized production given it was more profitable. The $80 price overshot the true equilibrium point, which commodity markets are prone to do on both the upside and downside.
At a point, the extra supply incentivized by the higher price will hit demand. Eventually supply will exceed demand and prices fall. Even with the loss of Iranian production and the temporary drop in Saudi supply, there was enough spare capacity within OPEC and in reserve inventories to accommodate these shortages.
Inventories are typically measured through commercial and refinery stocks within developed market economies. (This is different from Strategic Petroleum Reserves (SPR), which are another type of buffer.) Even so, emerging markets like China and Saudi Arabia have built up ample inventories as strategic reserves, which also helps to smooth out oil prices.
In 2018, China made a tactical bet that oil in the $70s wouldn’t last and preferred to tap into its inventories and decreasing its flow of imports. It was right, as those higher prices faded. Since then, seeing oil in the $40s and $50s, it has begun stockpiling its oil inventories again.
To cope with the transitory September 2019 outage, the Saudis drew down inventories to keep its exports flowing as normal. Developed market strategic petroleum reserves could cover 4-5 months’ worth of a 5.7 million barrels per day outage like we saw with the Abqaiq incident.
US shale can react to changes with an approximate 3-6 month response time. In the past, any oil shock would require a change in the price until enough demand was extinguished to reach a new equilibrium point in the market. With shale’s short-cycle potential, the prospect of production being ramped significantly in a short period of time has allayed worries over a structural shortfall.
With that said, the 3-6 month “wait time” means there is still a delay. Moreover, investors are no longer content with shale producers simply pursuing growth without staying in tune with the unit economics of the business. After all, a business is only worth something if it can make money, not simply prove that it can grow revenues or accumulate assets without recourse to whether resources are being spent wisely pursuing such growth.
Nonetheless, we can be certain that the oil market is better equipped to handle supply shortfalls much better than it did in the past.
In terms of the idea of whether oil prices are priced efficiently, the $55 WTI prices does make sense in terms of Saudi Arabia’s balance of payments breakeven. Saudi Arabia is still the world’s most influential oil producer in the world. It is, in a sense, the Federal Reserve of the oil world. It has great influence over setting the price of oil in the same way the Fed has such strong reach on setting the price of credit globally.
As mentioned, the balance of payments breakeven is the most important of the major equilibrium points for oil exporters – i.e., cost of production breakeven, balance of payments breakeven, and fiscal balance or primary balance breakeven – because it determines the point at which their capital flows deficit would need to be plugged through external funding. So, it has the biggest impact on global capital flows and oil has a lot of knock-on effects on other markets.
The shape of the crude oil curve also matters. It shows the price today versus the prices at various points in the future. The futures curve is backwardated. This means that longer term prices are lower than the current spot rate. This matters because many traders are motivated stay long if the positive roll yield from the backwardated curve is better than cash assuming positive convexity.
The fact that long-term oil prices didn’t change significantly despite showing that Saudi assets are extremely vulnerable and Iran acted out without consequences seems like there’s insufficient risk premium being priced in.
But it could also reflect slower economic growth reducing long-run demand for oil. It could reflect that the lack of a US response brings in higher odds of eventual Iran negotiations with the US (as opposed to if the situation got confrontational in a militaristic way).
What other pressure points are there in the oil market?
There is a big difference between an oil processing plant and an oil field. Damage to oil processing facilities typically takes weeks or months to repair. Damage to a field where extraction is disrupted is much more difficult to recover from and could take years to restore. An escalated military conflict that destroyed multiple processing facilities and oil fields would be much more disruptive to the longer term oil outlook.
We do know that the Strait of Hormuz accounts for one-quarter of all oil volumes being transported on a daily basis. The passageway also accounts for one-third of all liquefied natural gas. If there was a closure, this could have a meaningful effect depending on the duration. Given the US military presence there, such a closure is unlikely and would probably take a larger military conflict to get to that point.
While the Mideast receives a lot of focus, the US has its own unique share of risks. The 2020 election(s) are coming up next year, which puts the presidency up for grabs and will change the ideological composition of Congress to a degree.
Some Democratic presidential candidates would like to put on outright prohibition on hydraulic fracking. Shale has been the largest source of new oil production over the past decade. Given its importance in the US and for the stability of the oil markets, this would have a negative effect on the US and global economy.
With that said, campaign promises don’t always become reality. A total prohibition on fracking activity, even if a candidate like Elizabeth Warren were to become president, is not likely.
But there are two avenues in which this is adding risk to the shale industry: (i) regulatory/legal headwinds and (ii) a higher cost of capital due to greater investor risk aversion. A Trump victory would help alleviate some of these concerns while a Democratic win could likely cause longer-term oil prices to rise due to fears that US shale production could be impaired going forward.
Conclusion
There is never any shortage of things to worry about in global markets. The range of things that you don’t know and aren’t cognizant of is always going to be higher than the range of things that you do know and can be aware of.
Oil is a very important strategic commodity that has an impact on growth, inflation, interest rates, and capital flows, and is accordingly an influence on various financial markets.
Oil shocks are not as influential as they have been in the past. The US is more self-sufficient in that can produce a lot of oil. US shale has been the biggest source of additional oil production over the past decade. Given shale’s short-cycle nature, it can be ramped up and down quickly to plug supply gaps in the market, leading to fewer sharp swings in the market and better anchoring long-run prices.
The impact on oil swings on global financial markets depends on not only the feed through into rates, growth, inflation, and flows, but how it changes the perception with regard to geopolitical risk.