Volatility Term Structure Trading


Volatility term structure trading involves strategies that take advantage of the differences in implied volatility across different maturities for options on the same underlying asset.
The implied volatility term structure (IVTS) refers to the relationship between the implied volatilities of options with the same underlying asset but different expiration dates.
Key Takeaways – Volatility Term Structure Trading
- Volatility term structure is a variation of implied volatility across different option maturities (reflecting market volatility expectations).
- Exploits Volatility Differences – Uses variations in implied volatility across different maturities to generate profits.
- Risk Management – Critical to monitor Greeks, particularly vega and gamma, for balanced exposure.
Key Concepts
Implied Volatility (IV)
- Definition – Implied volatility represents the market’s expectations of the underlying asset’s volatility over the life of the option.
- Calculation – It is derived from the market price of the option using models such as Black-Scholes.
Term Structure of Volatility
- Definition – This term structure illustrates how implied volatility varies for options with different maturities.
- Shape – It can take various shapes (upward sloping, downward sloping, humped, etc.), reflecting market expectations about future volatility.
Trading Strategies
Calendar Spreads
Involves buying and selling options with different expiration dates but the same strike price.
Types
- Horizontal Spread – Same strike prices, different maturities.
- Diagonal Spread – Different strike prices and different maturities.
Objective
To profit from changes in the term structure of volatility.
For example, if the front-month volatility is expected to decline relative to the longer-term volatility, traders might sell short-term options and buy longer-term options.
Volatility Arbitrage
Exploiting differences between implied volatility and realized volatility or between implied volatilities of different maturities.
Techniques
- Delta-Neutral Strategies – Construct positions that are neutral to the direction of the underlying asset but exposed to changes in volatility.
- Vega-Weighted Positions – Focus on the sensitivity of the portfolio to changes in volatility.
Long Gamma/Short Gamma Strategies
- Long Gamma – Involves buying options to benefit from increases in volatility.
- Short Gamma – Involves selling options to profit from the decay of implied volatility or to capture the premium.
Risk Management
Volatility Skew and Smile
- Skew – The pattern in which out-of-the-money (OTM) options have different implied volatilities compared to at-the-money (ATM) options.
- Smile – A symmetric skew where both deep OTM calls and puts have higher implied volatilities compared to ATM options.
- Impact on Strategy – Understanding the skew and smile is important as it impacts the pricing of options and the profitability of volatility term structure strategies.
Greeks
- Delta – Measures the sensitivity of the option price to changes in the underlying asset price.
- Gamma – Measures the rate of change of delta with respect to the underlying asset price.
- Vega – Measures the sensitivity of the option price to changes in volatility.
- Theta – Measures the time decay of the option’s price.
Related: Options Greeks
Practical Application
Assessing Market Conditions
Identify the shape of the IVTS and market expectations for volatility.
Constructing Positions
Develop calendar spreads or volatility arbitrage positions based on the IVTS shape.
Monitoring Greeks
Be sure the portfolio’s risk exposures are managed, particularly vega and gamma.
Adjusting Positions
Dynamically adjust the positions as markets and the term structure of volatility change.
Trade Example of Volatility Term Structure Trading
Consider a scenario where the IVTS is upward sloping, indicating higher future volatility, but a trader believes that that future volatility is still underpriced (i.e., should be even higher).
A trader might:
- Buy longer-term options (e.g., six months to expiration) to gain from expected increases in volatility.
- Sell shorter-term options (e.g., one month to expiration) to capture the premium, betting that short-term volatility will remain lower than implied by the current prices.
Delta Hedging
To isolate volatility and minimize directional risk, the trader would employ delta hedging.
Delta measures an option’s sensitivity to changes in the underlying asset’s price. Here’s how the trader can delta hedge this strategy:
1) Calculate Delta
Determine the delta of both the long-term and short-term options.
Suppose:
- the long-term option has a delta of 0.5 and
- the short-term option has a delta of 0.3
2) Net Delta
Compute the net delta of the combined position.
For example, if the trader buys one long-term option and sells one short-term option, the net delta is 0.5 – 0.3 = 0.2
3) Hedge Delta
To neutralize this delta, the trader would take an opposite position in the underlying asset.
In this case, they would sell 0.2 units of the underlying asset for each spread created.
4) Adjust Continuously
As the price of the underlying asset changes, the deltas of the options will also change. The trader will need to continuously adjust the position in the underlying asset to maintain a delta-neutral position.
Overall
By delta hedging, the trader effectively isolates the position’s exposure to changes in volatility.
This enables them to profit from the expected increase in long-term volatility without being affected by the underlying asset’s price movements.
Volatility Surface
A volatility surface is a three-dimensional plot that visualizes the implied volatility of options across different strike prices and maturities for a given underlying asset.
It provides a comprehensive view of how implied volatility, an important input in options pricing, varies across both dimensions.
Key Components
Strike Price (X-axis)
The price at which the option can be exercised.
Options can be in-the-money, at-the-money, or out-of-the-money, depending on the strike price relative to the current price of the underlying asset.
Maturity (Y-axis)
The time remaining until the option’s expiration, typically measured in days, months, or years.
Implied Volatility (Z-axis)
The market’s expectation of the underlying asset’s volatility over the option’s life.
Implied volatility is derived from the option’s market price using models like Black-Scholes.
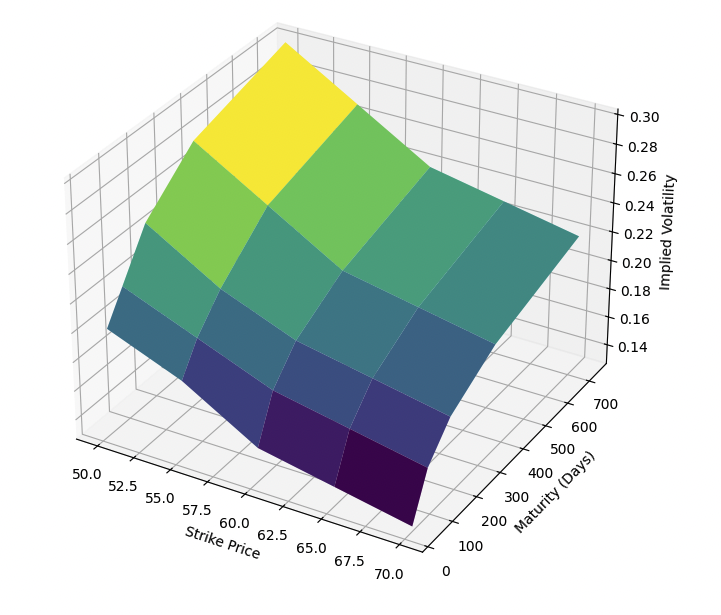
Volatility Surface Diagram
We can design a diagram of a volatility surface by designing some arrays and then plotting them:
import numpy as np

import matplotlib.pyplot as plt

from mpl_toolkits.mplot3d import Axes3D

# Sample data for a 3D volatility term structure

strikes = np.array([50, 55, 60, 65, 70])

maturities = np.array([30, 90, 180, 365, 730])

implied_vols = np.array([

[0.20, 0.18, 0.15, 0.14, 0.13],

[0.22, 0.20, 0.18, 0.17, 0.16],

[0.25, 0.22, 0.20, 0.19, 0.18],

[0.28, 0.25, 0.22, 0.21, 0.20],

[0.30, 0.27, 0.24, 0.23, 0.22]

])

# Meshgrid for plotting

X, Y = np.meshgrid(strikes, maturities)

Z = implied_vols

# Plot the 3D volatility term structure

fig = plt.figure(figsize=(12, 8))

ax = fig.add_subplot(111, projection='3d')

ax.plot_surface(X, Y, Z, cmap='viridis')

ax.set_title('3D Volatility Term Structure')

ax.set_xlabel('Strike Price')

ax.set_ylabel('Maturity (Days)')

ax.set_zlabel('Implied Volatility')

plt.show()
3D Volatility Surface
Shapes of the Volatility Surface
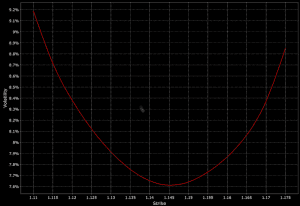
Volatility Smile
Often observed in equity options, where implied volatilities are higher for deep in-the-money and out-of-the-money options compared to at-the-money options.
This forms a U-shape when plotted against strike prices for a fixed maturity.
Like so:
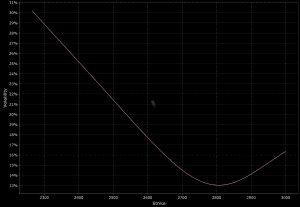
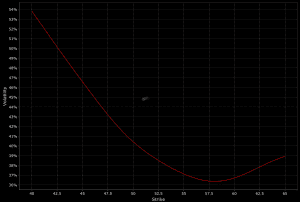
Volatility Skew
Implies a systematic pattern where implied volatilities vary across strike prices, often higher for lower strike prices (puts) or higher strike prices (calls).
This reflects market sentiment and hedging pressures.
Below are two examples:
Term Structure of Volatility
The pattern of implied volatility across different maturities.
It can be upward sloping (implying higher future volatility) or downward sloping (implying lower future volatility).
Practical Applications
Risk Management
Traders use the volatility surface to understand the relative expensiveness of options and to hedge portfolios.
Understanding the surface helps in constructing more effective hedging strategies.
Pricing and Trading Strategies
By analyzing the volatility surface, traders can identify mispriced options and implement strategies such as volatility arbitrage, calendar spreads, and straddles.
Model Calibration
The volatility surface is essential for calibrating options pricing models to make sure they reflect market conditions accurately.
Models like SABR or stochastic volatility models are often used for this purpose.
Construction
The volatility surface is constructed using market data for option prices across various strike prices and maturities.
Sophisticated interpolation and extrapolation techniques are used to fill in the gaps where market data is sparse, for a smooth and continuous surface.
Other Concepts
Volatility-of-Volatility Term Structure
The volatility-of-volatility term structure represents the variation in the volatility of implied volatility across different option maturities.
It provides insights into market expectations of future volatility uncertainty.
It helps traders and risk managers better understand the potential for significant volatility shifts over time.
The VVIX (volatility of VIX) is the most popular vol-of-vol term structure gauge.
Article Sources
The writing and editorial team at DayTrading.com use credible sources to support their work. These include government agencies, white papers, research institutes, and engagement with industry professionals. Content is written free from bias and is fact-checked where appropriate. Learn more about why you can trust DayTrading.com