Downside Beta vs. Upside Beta (Dual-Beta)

Downside Beta and Upside Beta, collectively referred to as Dual-Beta, are concepts in finance used to measure the volatility of an asset in relation to a benchmark but in two different scenarios:
- negative (downside) and
- positive (upside) market movements
This bifurcation allows traders/investors to understand how an asset behaves under varying market conditions.
This provides a more nuanced view than traditional beta.
Key Takeaways – Downside Beta vs. Upside Beta (Dual-Beta)
- Downside Beta measures a portfolio’s sensitivity to market declines, while Upside Beta assesses its responsiveness to market gains.
- Both are compared to a benchmark.
- Dual-Beta analysis provides a more nuanced understanding of investment risk by separately evaluating performance in market upswings and downturns.
- This approach helps investors identify assets or portfolios with asymmetric risk profiles.
- It helps in constructing portfolios that align with specific risk-return objectives.
- We do an example in Python below, where we calculate the covariance of a portfolio’s returns with the benchmark’s returns.
Downside Beta
Definition
Downside Beta measures the asset’s sensitivity to the benchmark’s negative returns.
It is calculated by focusing only on the periods when the benchmark has negative returns.
Significance
Downside Beta is crucial for understanding the asset’s performance during market downturns.
A high Downside Beta indicates that the asset tends to perform worse than the benchmark during declining markets.
Calculation
Downside Beta is calculated using a modified form of the standard beta calculation, where only the data points where the benchmark returns are negative are considered.
Upside Beta
Definition
Upside Beta assesses how an asset reacts to the benchmark’s positive returns.
It focuses on periods when the benchmark experiences positive growth.
Significance
Upside Beta is important for evaluating the asset’s performance during market upswings.
A high Upside Beta suggests that the asset typically outperforms the benchmark during market rallies.
Calculation
Similar to Downside Beta, Upside Beta is calculated by considering only the instances when the benchmark returns are positive.
Dual-Beta Model
Concept
The Dual-Beta model breaks down the traditional beta into two separate measures, providing a more detailed view of an asset’s systematic risk.
Application
Investors use this model to gain insights into the risk-return profile of an asset in different market conditions.
It helps in constructing a portfolio that aligns with their risk tolerance and market outlook.
Advantages
Detailed Risk Profile
By separating the beta into downside and upside components, investors get a clearer understanding of how an asset might behave in different market scenarios.
Improved Investment Decisions
Knowing the dual-beta of assets can guide investors in choosing securities that match their market expectations and risk appetite.
Enhanced Portfolio Management
Portfolio managers can use downside and upside betas for better asset allocation – especially in tailoring portfolios to be more defensive or aggressive.
Limitations
Complexity
The calculation and interpretation of Downside and Upside Beta are more complex than traditional beta.
They require more sophisticated analysis tools.
Data Sensitivity
The accuracy of Downside and Upside Beta calculations heavily depends on the quality and period of historical data used, which can lead to different interpretations.
Market Conditions
These measures are based on historical market conditions and might not accurately predict future asset behavior, especially in rapidly changing or unprecedented market environments.
Downside Beta vs. Upside Beta (Dual-Beta) – Example in Python
Calculating Downside and Upside Beta (Dual-Beta) involves computing the covariance of a portfolio’s returns with the benchmark’s returns, separately for the periods when the benchmark’s returns are below and above its average.
Here’s an example in Python that shows how you might think about it.
First, make sure you have the necessary libraries:
pip install pandas numpy
You can write the Python script like this:
import pandas as pd

import numpy as np


# This just sample data - Replace with your actual portfolio and benchmark returns

data = {

    'Portfolio_Returns': [0.02, 0.03, -0.01, 0.04, 0.03, -0.02, 0.05, 0.01, -0.03, 0.04],

    'Benchmark_Returns': [0.015, 0.025, -0.005, 0.035, 0.02, -0.01, 0.045, 0.02, -0.025, 0.035]

}

returns = pd.DataFrame(data)


# Here we calculate the mean of the benchmark returns

benchmark_mean = returns['Benchmark_Returns'].mean()


# Then you can separate the returns into upside and downside

upside = returns[returns['Benchmark_Returns'] > benchmark_mean]

downside = returns[returns['Benchmark_Returns'] <= benchmark_mean]


# Now Calculate Upside and Downside Beta

upside_beta = np.cov(upside['Portfolio_Returns'], upside['Benchmark_Returns'])[0, 1] / np.var(upside['Benchmark_Returns'])

downside_beta = np.cov(downside['Portfolio_Returns'], downside['Benchmark_Returns'])[0, 1] / np.var(downside['Benchmark_Returns'])


print(f"Upside Beta: {upside_beta}")

print(f"Downside Beta: {downside_beta}")
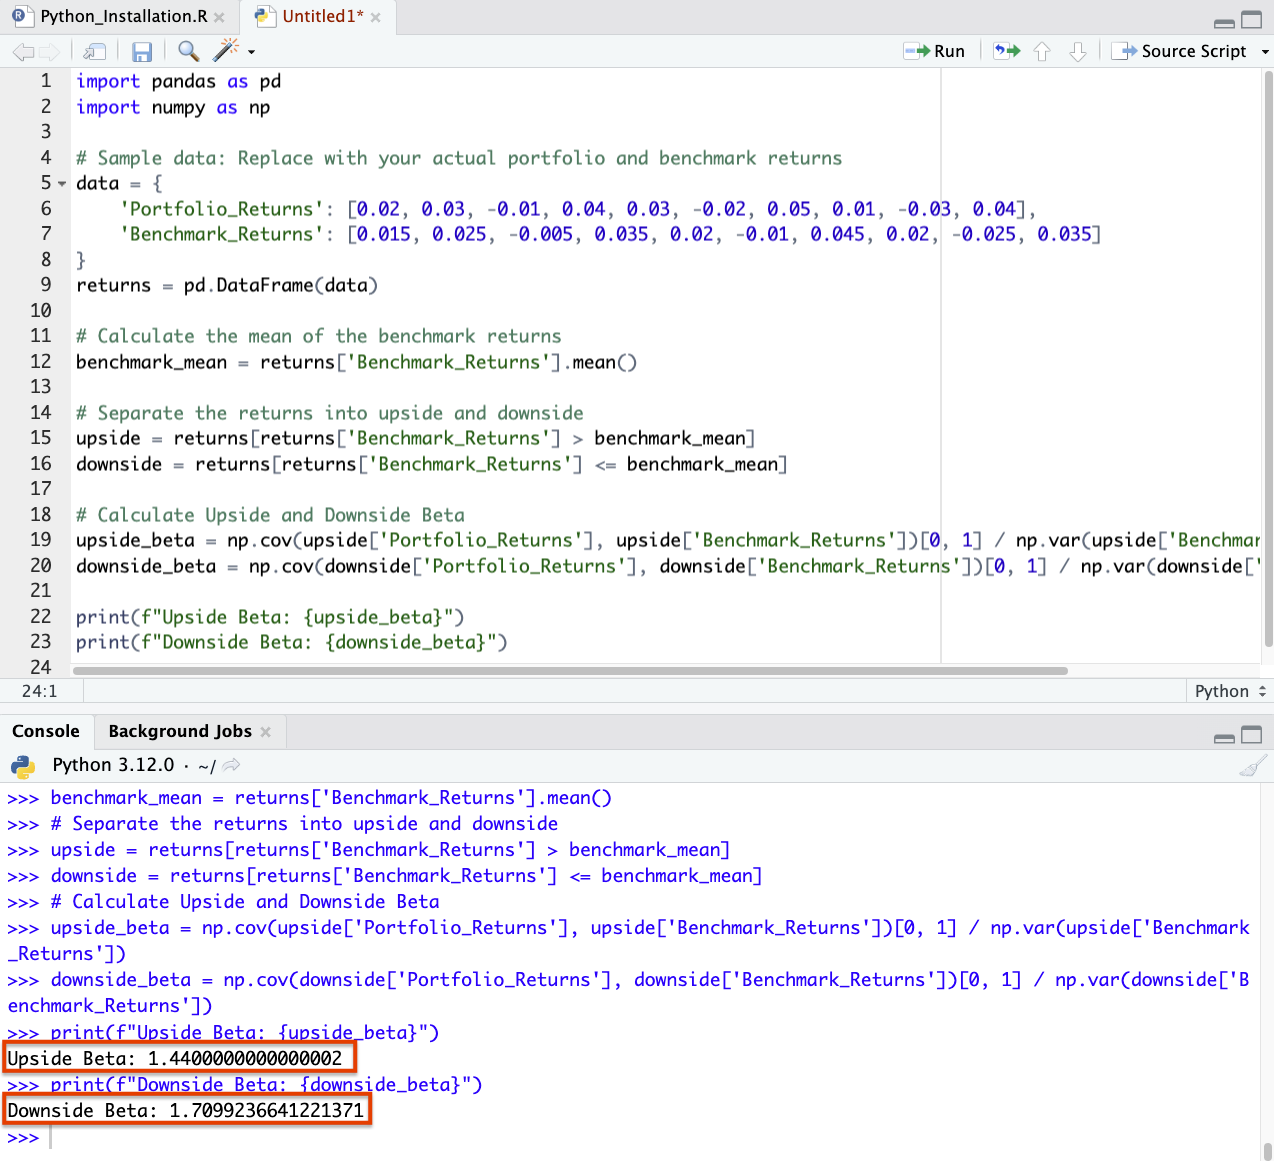
This script calculates the Downside and Upside Beta of a portfolio compared to a benchmark.
You will get the answers in your preferred IDE:

Considerations
These measures are more informative when you have a larger dataset.
Small datasets might not accurately represent the portfolio’s behavior in different market conditions.
Conclusion
Downside Beta and Upside Beta offer a refined perspective on an asset’s volatility and risk profile.
They’re most useful for traders/investors who wish to differentiate their strategies based on market phases.
They require careful interpretation and an understanding of their complexity and limitations.