Positive Volume Index

The positive volume index (PVI) fulfils the same use as the negative volume index (NVI). That is, volume can help inform future price movement. The PVI increases on days when volume has increased from the previous trading day.
Top PVI Analysis Trading Brokers
The premise behind the PVI is that the “not-so-smart” money is most active on the higher volume days and is more emotionally reactive to movements in the market caused by higher volume. One should note that while this assumption may tend to be true overall, it is not always necessarily a fact, which can undermine the usefulness of the indicator.
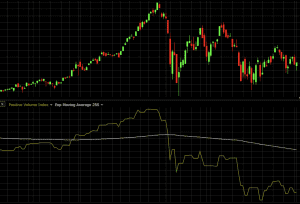
Because volume tends to increase in trending markets, the PVI will have a high correlation to price and typically follow the general trend.

(Positive volume index plotted against a daily chart of the S&P 500)
The PVI is normally used on the daily timeframe, though it can also be used on larger charting time compressions (e.g., weekly, monthly). Note that many charting software programs only accumulate volume data at the daily level or higher. This makes it best suited for swing or position traders, who hold assets over the course of days, weeks, or months.
Calculation of the Positive Volume Index
If today’s volume is greater than the previous day’s volume, then the PVI will change according to this formula:
PVI = Yesterday’s PVI + [[(Close – Yesterday’s Close) / Yesterday’s Close] * Yesterday’s PVI
When volume is less than or equal to the previous day’s volume then the formula is simply:
PVI = Yesterday’s PVI
Usage Alongside the Negative Volume Index
The positive volume index is often used in tandem with the negative volume index (NVI). With the NVI, the indicator increases when volume decreases from the day before under the assumption that the “smart money” is active on lower volume days.
If one trusts this presumption as sound – i.e., “smart money” active on low volume days and “not-so-smart money” active on high volume days – one might plot both indicators and look for divergences to signal trading opportunities.
For example, a buy/long opportunity might be viewed under the following circumstances:
- Positive volume index declining (i.e., “not-so-smart money” getting out)
- Negative volume index increasing (i.e., “smart money” getting in)
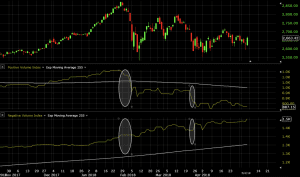
In the following image, we can see a couple decent instances of this playing out where the ellipses are placed in the PVI and NVI charts:

In both cases, the PVI is declining and the NVI is flat to increasing.
Also note that the moving averages associated with each can indicate broader scale direction as well. The indicators normally come paired with 255-day moving averages (there are approximately 250-255 trading days per year). In the case of this market, it shows that since the drop in the market toward the middle of the chart, the “not-so-smart” money has been selling (i.e., PVI declining) while the “smart” money has been buying (i.e., NVI increasing) as the market is viewed as becoming cheaper.
Using the Positive Volume Index within a Trading System
The common strategy, as mentioned in the preceding section, is to use the PVI in tandem with the NVI. Divergences between the two are looked at as potential trading opportunities.
To increase the accuracy of such signals, traders may choose to pair this with strategy with a form of trend following. A basic moving average or set of moving averages can help accomplish this.
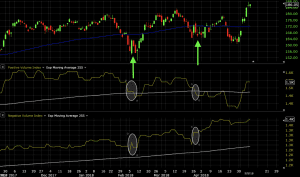
Below we see two particular divergences between the PVI and NVI. The PVI (directly below the price chart) is declining while the NVI (bottom chart) is increasing. This is a bullish setup, suggesting “smart money” is getting in while “not-so-smart money” is getting out. At the same time, the 100-day simple moving average is positively sloped, also biasing trades long.

Therefore, when we see clear divergence between the two in a bullish sense (PVI down, NVI up) with the 100-day simple moving average also supporting the trade, this could support a bullish entry. This type of bullish setup would be most common when markets decline. Namely, “smart money” buys the dip; “not-so-smart money” sells because of the volatility; and the overall positive trend of the asset supports a positively sloped moving average. It’s a type of setup that supports the “buy low, sell high” maxim.
Conclusion
The positive volume index notes when the “not-so-smart money” is most active in the market. It is usually paired alongside the negative volume index and divergences between the two are often used to identify prospective trading opportunities.
These setups often model how institutional traders make decisions, especially in equity markets.
Namely, during times of market turbulence and declining prices, the “not-so-smart money” typically sells their holdings being more reactive to volatile price movements, while the “smart money” generally views the asset as becoming cheaper and is more inclined to buy.
On the other hand, during times of market melt-ups, the “not-so-smart money” is more inclined to hold or buy more of an asset thinking it’s a good investment. The “smart money” will be more likely to sell the asset believing it’s becoming more expensive. In this sense, this type of setup – i.e., using both the PVI and NVI simultaneously – can act as a contrarian indicator.
Supporting modes of analysis and indicators to identify trend, momentum, and/or whatever other factors may be of value are encouraged and up to the personal discretion of the trader.


