Negative Volume Index (NVI)

The Negative Volume Index (NVI) trading indicator tracks cumulative changes in volume and is designed to understand when the “smart money” is active.
Top Brokers For NVI Analysis & Trading
The central idea is that the “smart money” is most active on days when volume is light and markets are calm. On the other hand, the “not-so-smart money” is most active on days where volume is high and markets are choppier. The general idea is that the “not-so-smart” money tends to be more reactive to market events – especially in an emotional sense – than “smart money”.
The NVI is one of the oldest indicators used in modern-day charting, having dated back to the 1930s. It is traditionally used on stock market indices, though is also commonly applied to individual stocks. If a charting software program does not carry volume on particular securities and asset markets then the NVI cannot be used. This is often the case on markets such as currencies/forex or commodities.
The original version developed by Paul Dysart was a cumulative indicator that added net advances when volume decreased from one period to the next. (Net advances are the number of stocks in an index in which price goes up minus the number that go down. For example, if an index contains 30 stocks and 22 go up while 8 go down, the net advances would be 14, or 22 minus 8.)
Under the Dysart formula, the indicator would not increase period to period if volume increased. It could, however, reduce in value if net advances declined while volume decreased. Thus price moves on increasing volume are ignored entirely.
Later on, Norman Fosback came out with his own version of the indicator through a simple alteration and is the one used in practically all charting software platforms where the NVI is built in. Instead of net advances, Fosback used the percentage price change of a market in lieu of net advances. The idea is that this better pinpoints how strong of a move the market is making.
Calculation of the Negative Volume Index
The Negative Volume Index is calculated in just a few basic steps:
- NVI begins at 1,000
- If volume decreases, add the percentage price change of the index, stock, or anything that records volume to 1,000
- If volume increases, no change to the indicator
On top of this, a 255-day exponential moving average (EMA) is added to the chart to represent the trend in the indicator over the past year. (There are approximately 250-255 trading days per calendar year.)
Uses of the Negative Volume Index
It should be noted that the NVI is made to be used on the daily charting timeframe. This does not mean it can’t work on other charting timeframes, but this is the main time compression on which it’s examined.
Fosback noted that when the NVI is above the 255-day EMA, this favors a bull market (or uptrend). When the NVI is below the 255-day EMA, this favors a bear market (or downtrend).
The odds, however, are not symmetrical. Fosback states through his own testing that a bull market is 96% likely when the NVI is above the 255-day EMA. On the other hand, he found that there is just a 53% chance of a bear market when the NVI is below the 255-day EMA. Presumably, this testing was done on stock indices, as these tend to go up over time.
The odds would likely be symmetric is applied to currencies, which have no long-term directional bias. The same would be true with respect to commodities, which trade in cycles and also don’t have a directional bias as a whole.
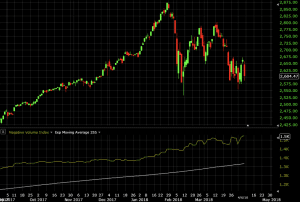
The NVI may see divergences between different stocks and the indices they’re wrapped up in. For example, on the S&P 500 chart, we can see the NVI clearly above the 255-day EMA. This suggests a continuation of an ongoing bull market.
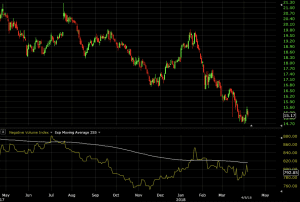
On the other hand, the NVI has remained mostly bearish on a stock like Kinder Morgan (KMI).
Trading the Negative Volume Index
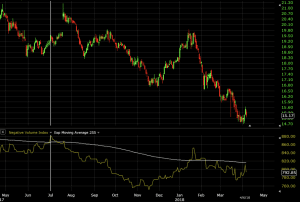
The NVI’s main trading signal is based on how it interacts with its 255-day exponential moving average. A break above the 255-day EMA is bullish. A break below the 255-day EMA is bearish.
For example, if we look at the Kinder Morgan (KMI) chart, we can see that a break above the 255-day EMA would have correctly predicted a move higher. (This is shown by the vertical white lines.)
Likewise, when the NVI broke back below the 255-day EMA, it did a nice job of diagnosing a future down move in the security.
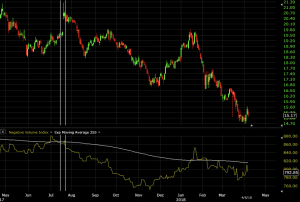
The indicator did not do the best job of diagnosing an up move on this third signal. Price began entering a clear down-leg about a week later.
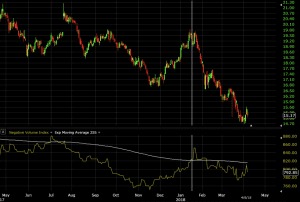
After re-breaking the 255-day EMA to the downside, this signal eventually worked out.
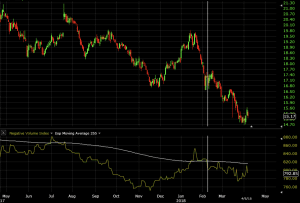
However, this should not be taken as a suggestion to trade the NVI on its own. The signals, if not more strongly filtered, are likely to be noisy.
For day traders, the NVI applied to the daily chart of the market you’re trading can be useful to provide of view of what’s going on from 30,000 feet. Even for those focused on trading short-term movements in the market, staying abreast of the longer-term trend is important. Trading in its direction can improve the statistical odds of any given trade working out.
Conclusion
The Negative Volume Index combines both price inputs and volume to form an indicator of when so-called smart and not-so-smart money is active. Volume is a binary input (increase or decrease). The indicator changes only when volume decreases from one period to the next. It runs on the assumption that informed or sophisticated traders/investors tend to be most active when volume is light.
Markets trending in one direction or another off lower volume are given weight. However, markets moving off high volume are virtually ignored by the NVI.
The indicator was designed for broad stock market indices and anything that has volume data associated with it. It may work well for some stocks. But it will work poorly for others, especially those that are thinly traded.
The NVI should not be traded in isolation. All indicators should be used in tandem with other methods of analysis.


