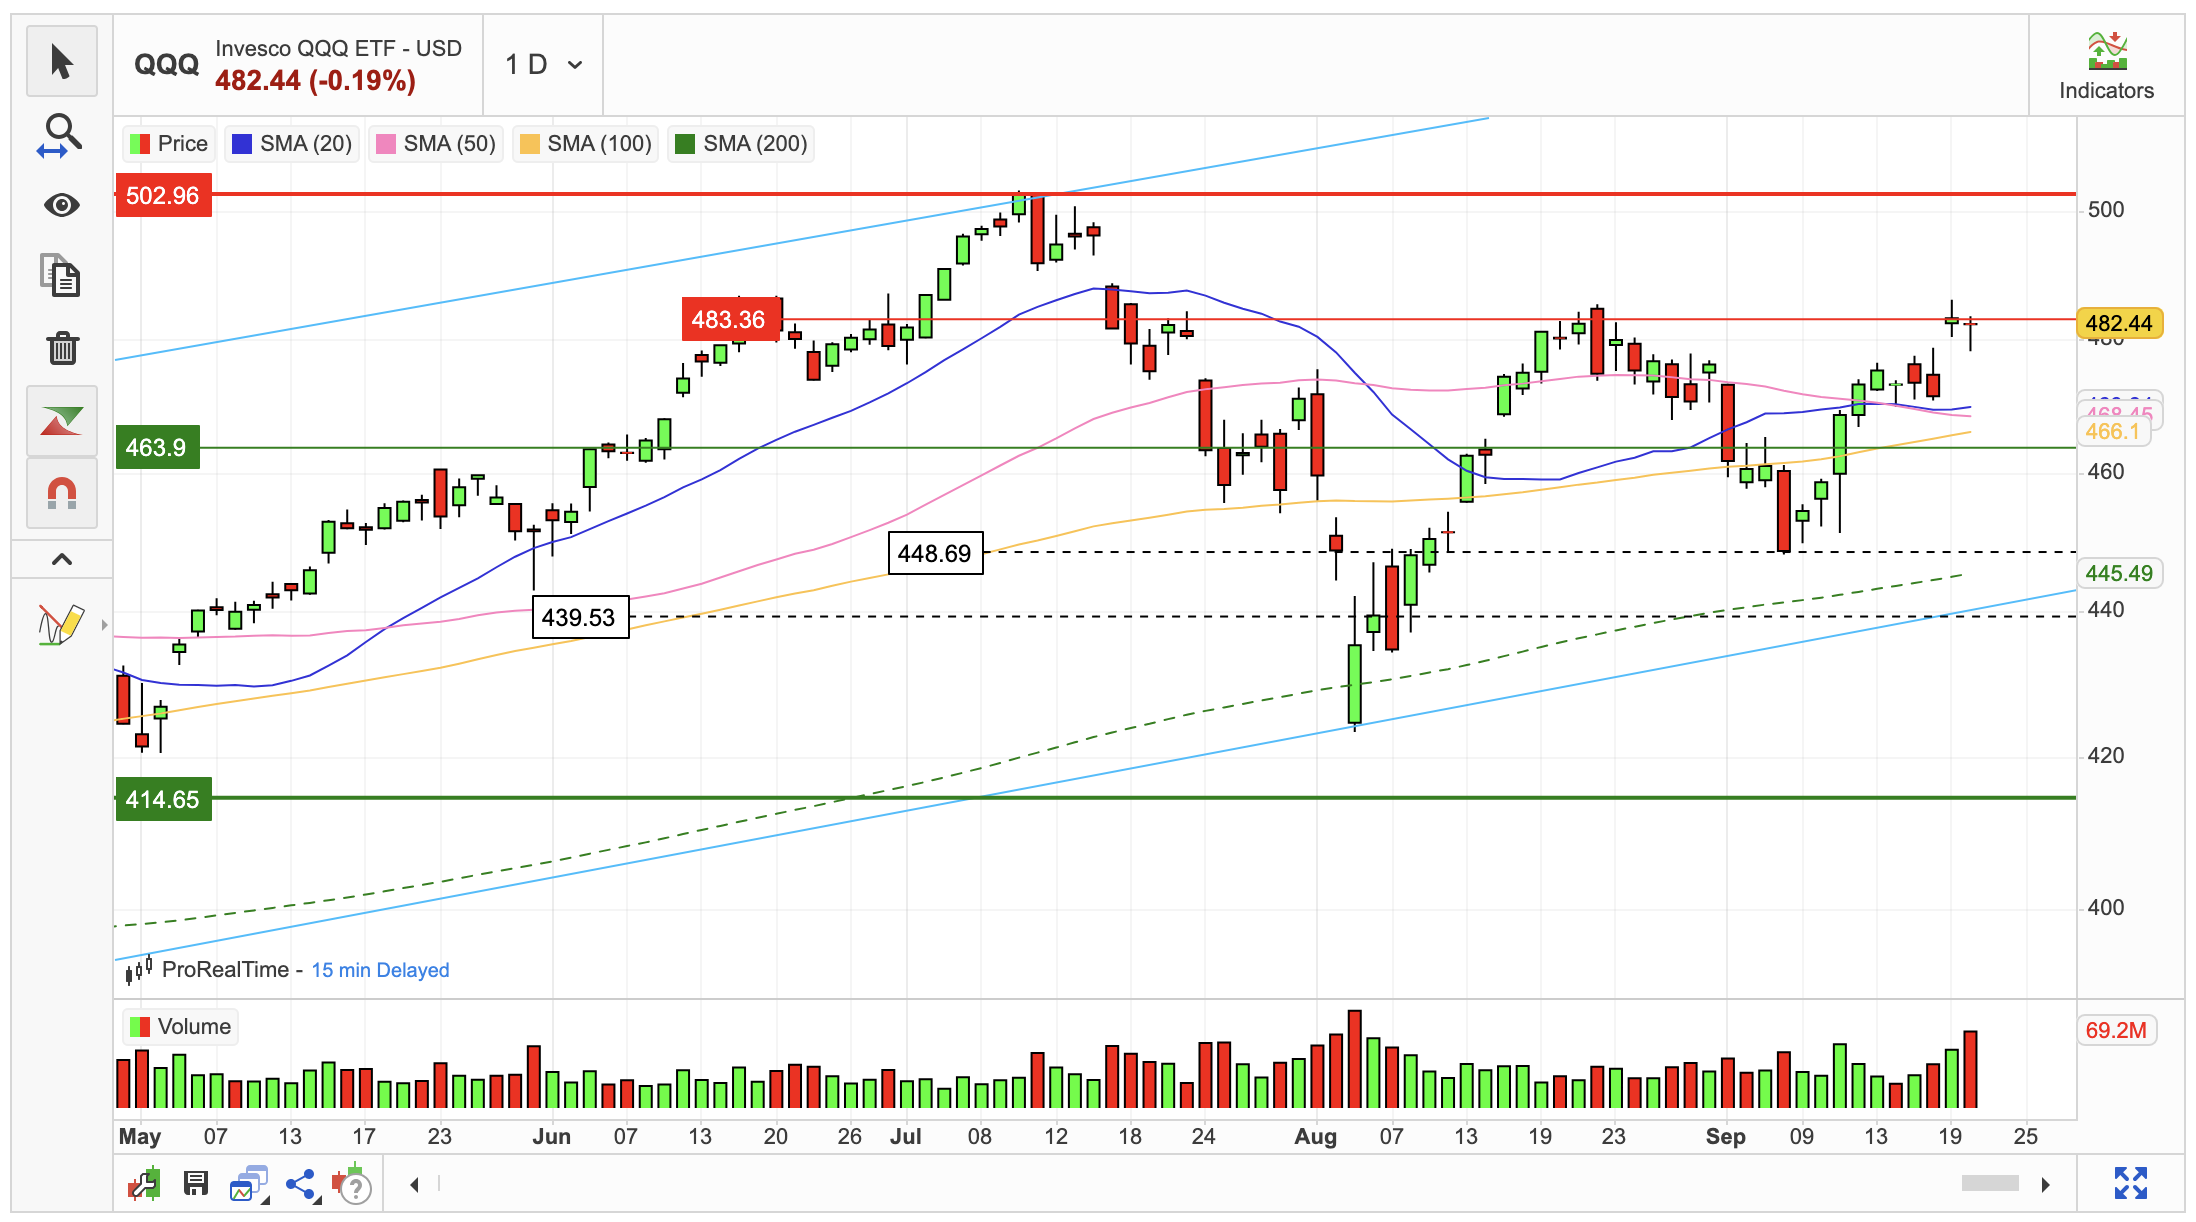
Weaker Technical Forecast For QQQ
- This topic has 0 replies, 1 voice, and was last updated 6 months ago by .
-
Topic
-
On September 20, 2024, the QQQ ETF experienced a slight decline, closing at $482.44, down from its previous day’s closing price of $483.36. This represented a 0.190% decrease.
Intraday trading was marked by moderate volatility, with the ETF’s price fluctuating by 1.13%. It reached a low of $478.30 and a high of $483.69.
Despite this short-term pullback, the QQQ ETF has exhibited a broader upward trend, gaining 7.52% over the past two weeks. This positive momentum is supported by the fact that it has closed higher on 7 of the last 10 trading days.
A noteworthy development on September 20th was the simultaneous decline in both price and trading volume. This inverse relationship can often be interpreted as a positive sign, as it suggests that selling pressure is decreasing. On that day, trading volume decreased by 19 million shares, reaching a total of 32 million shares exchanged.
Currently, the QQQ ETF is trading near the upper end of a wide, descending price channel. This positioning typically suggests a potential selling opportunity for short-term traders, as a pullback towards the lower boundary of the channel is often anticipated.
However, a breakout above the upper trend line, currently at $483.05, could signal a potential reversal of the downward trend.
