QQQ Summary September 23, 2024
- This topic has 0 replies, 1 voice, and was last updated 6 months ago by .
-
Topic
-
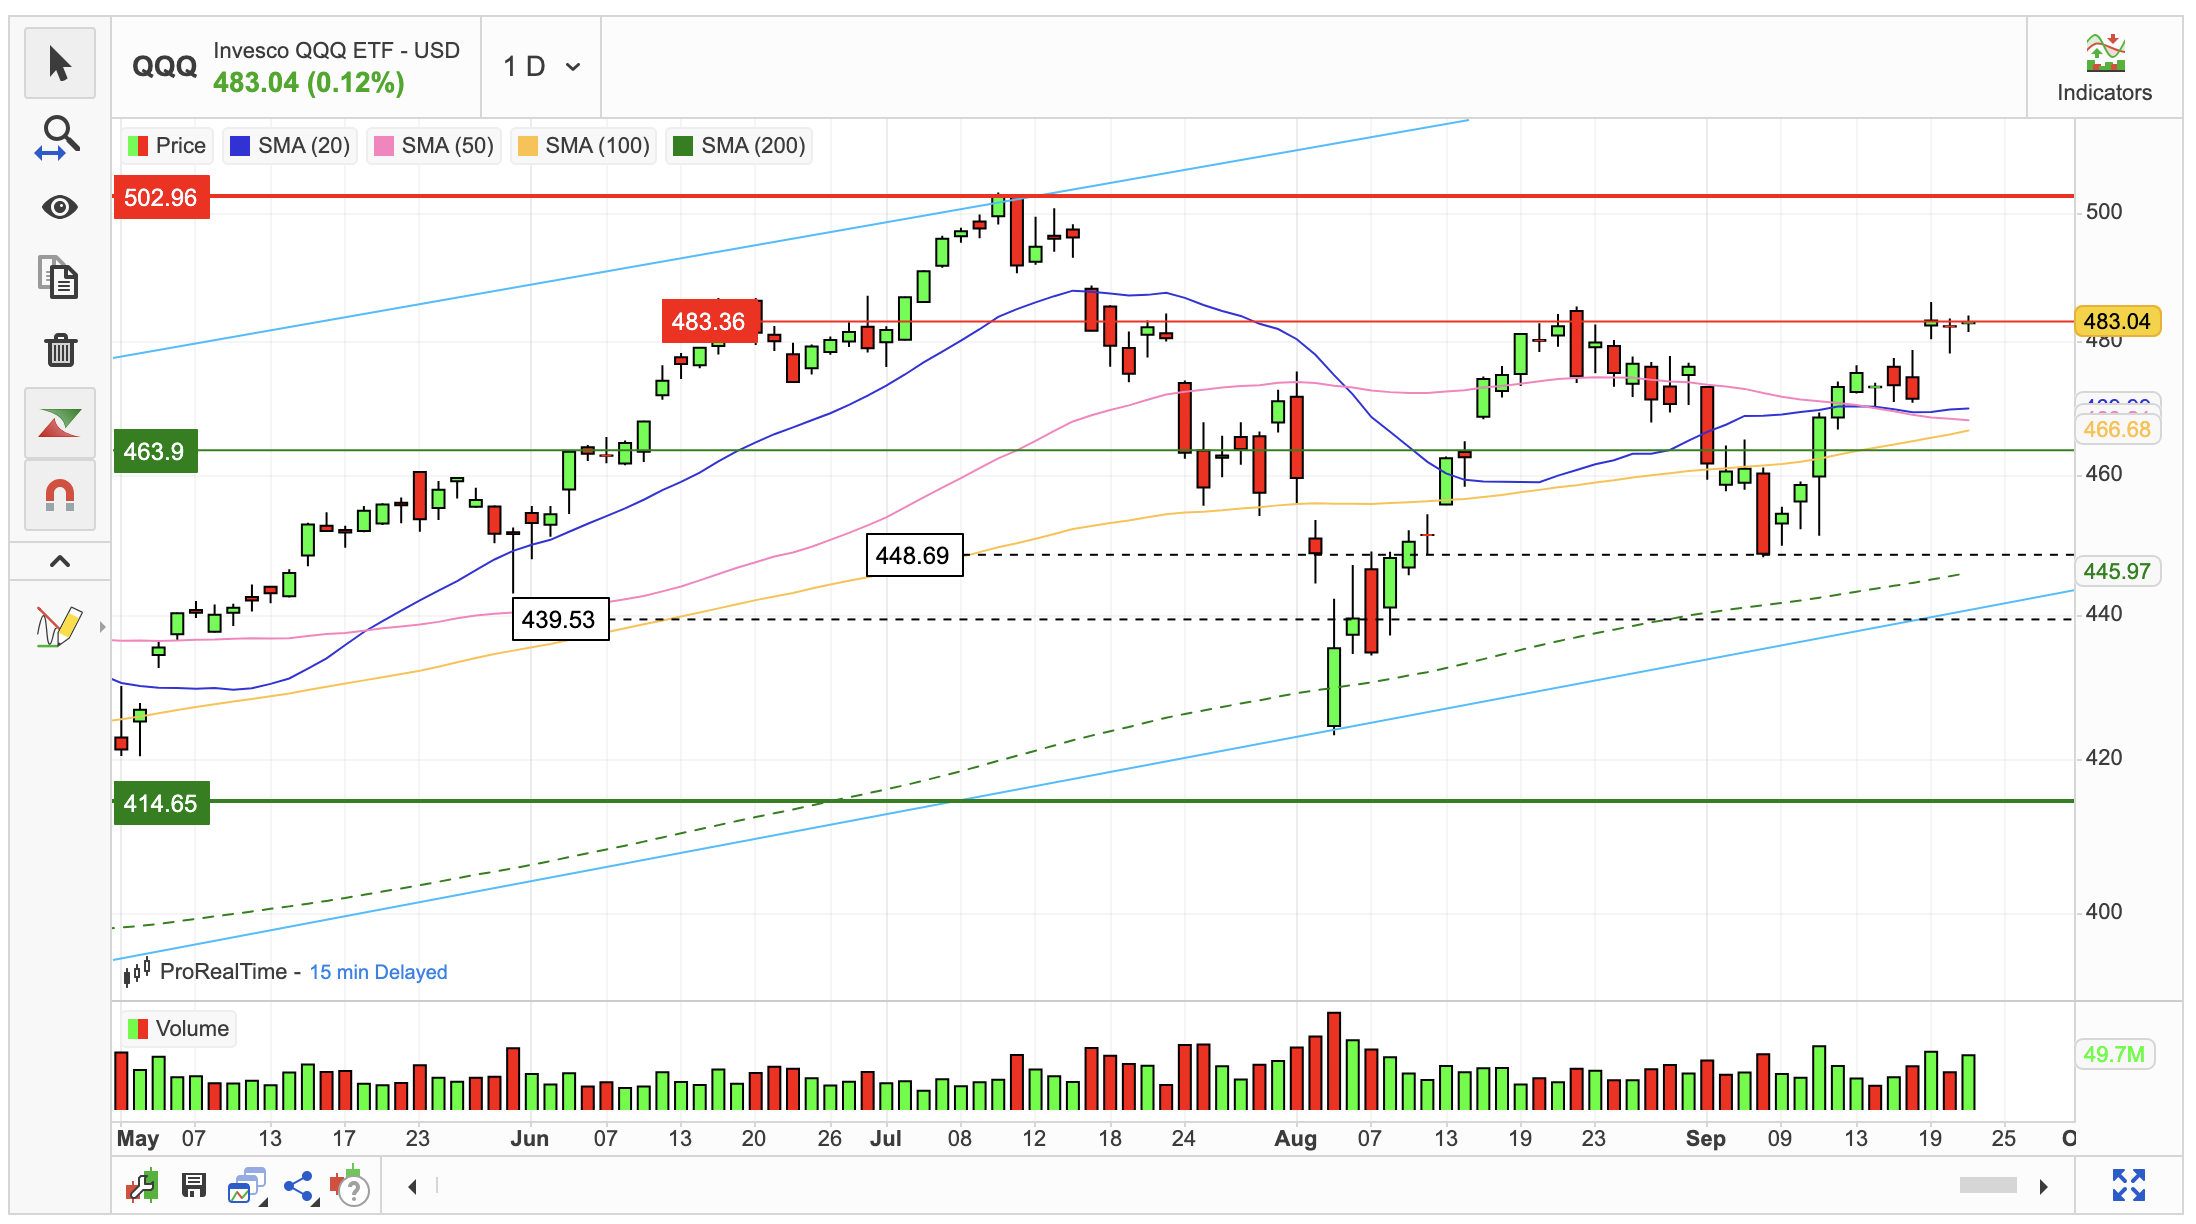
On September 23, 2024, the QQQ ETF experienced a modest uptick, closing at $483.04. This represents a 0.124% increase from the previous day’s closing price of $482.44.
Throughout the trading session, the ETF’s price fluctuated between a low of $481.60 and a high of $484.14, resulting in a daily range of 0.527%.
Over the past two weeks, the QQQ ETF has exhibited a bullish trend, gaining 6.29% and posting gains in seven out of ten trading sessions.
However, despite the price rise, trading activity declined significantly. The volume of shares traded dropped by 9 million to 24 million, representing a total transaction value of approximately $11.55 billion.
The combination of rising prices and declining volume can sometimes indicate a divergence, which may signal a change in market sentiment. This divergence could serve as an early warning of potential shifts in the market in the coming days.
From a technical perspective, the QQQ ETF has recently broken above a wide and falling short-term uptrend. While this initially suggests a slowing rate of decline, it could also be an early indication of a potential trend reversal.
If the ETF retraces, there may be support at the former resistance level of $482.80. This level could provide a second opportunity for traders to enter the market.
The next potential trend-top level is at $502.96, which could act as a significant resistance level that may not be easily breached on the second attempt.
