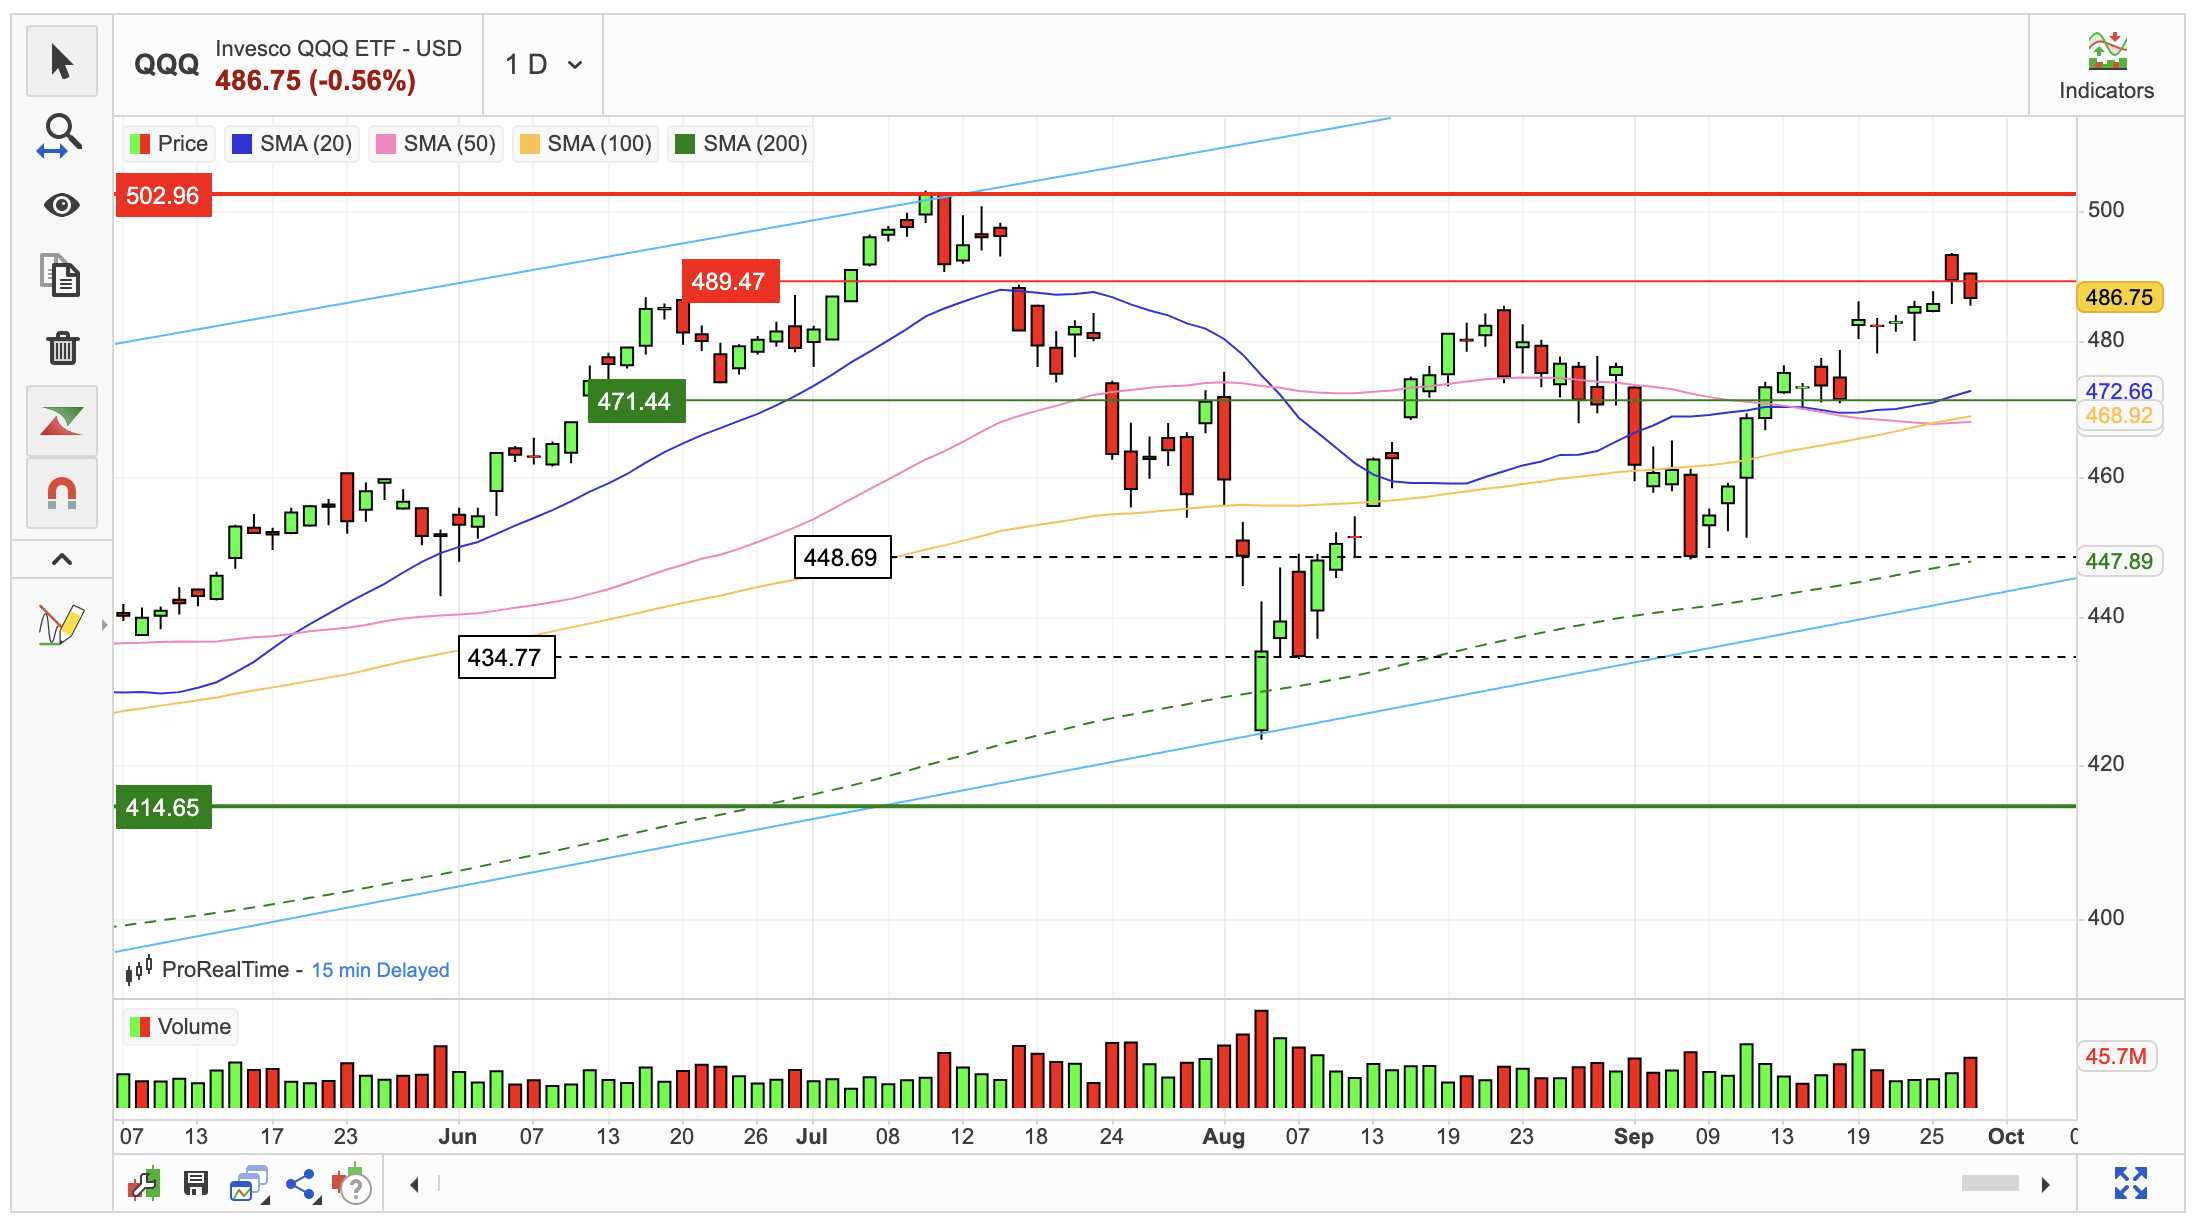
QQQ Down 0.556% On September 27, 2024
- This topic has 0 replies, 1 voice, and was last updated 1 year ago by .
-
Topic
-
The QQQ ETF experienced a slight decline on September 27th, closing at $486.75, a decrease of 0.556% from the previous day’s high of $489.47.
Intraday trading saw a fluctuation of 1.04%, with a low of $485.57 and a high of $490.64.
Over the past two weeks, the ETF has shown a positive trend, increasing by 2.4%. However, trading volume on September 27th declined, which is generally considered a bullish indicator as it suggests that selling pressure may be easing.
In the short term, the QQQ ETF appears to be consolidating near the upper end of a descending trend. This might present a potential selling opportunity for short-term traders who anticipate a pullback towards the lower end of the trend.
A break above the trendline resistance at $489.47 would signal a potential reversal of the downward trend.
Based on the current short-term trend, the ETF is projected to fall by approximately 2.08% over the next three months.
There’s a 90% probability that the price will remain within a range of $419.94 to $479.15 at the end of that period.

Data: FactSet, Morningstar, S&P Capital IQ, ProRealTime, MarketScreener, StockInvest