Stochastic Oscillator


The stochastic oscillator is a go-to tool for active traders looking to get a sense of momentum in financial markets like stocks, forex, and commodities.
It was created back in the 1950s by George Lane, and it works by comparing an asset’s closing price to its price range over a specific time.
Day traders love it because it helps them spot potential turning points and lets them know when the market might be overbought (too high) or oversold (too low).
Quick Introduction
- The stochastic oscillator compares the current price to the historical range, helping you identify potential reversal points by measuring momentum.
- When the oscillator is above 80, the market is often considered overbought and may face a pullback, while a reading below 20 suggests the market is oversold and could see a rebound.
- Short-term traders may see more noise and false signals with a faster, more sensitive stochastic setting, such as 5, 3 and 3.
- Its ability to identify overbought and oversold conditions, generate easy-to-interpret buy and sell signals, and compliment other indicators, makes it widely used in technical analysis.
Best Brokers For Stochastic Oscillator Analysis Trading
These 1 trading platforms offer the stochastic oscillator and are our leading recommendations for day traders:

How It Works
The stochastic oscillator operates on the principle that prices tend to close near the high end of the trading range in an uptrend, and in a downtrend, prices close near the low end.
By tracking this, the oscillator gives insights into the momentum behind price movements and helps identify possible turning points in the market.
Traders use the stochastic oscillator to understand momentum shifts and potential reversal points better, often using it with other indicators for confirmation.
One of the most overlooked strengths of the stochastic oscillator is its ability to spot when markets are moving sideways, or ‘ranging.’ It’s said that markets are range-bound about 80% of the time.Many traders learn the hard way that avoiding trades in these choppy periods is crucial. We typically make money in trending markets, not when prices are stuck in a range.
The Maths Behind The Stochastic Oscillator
Let’s quickly discuss the mathematics George Lane used to perfect this much-favored indicator.
%K Line: This is the main line in the stochastic oscillator. It shows where the current closing price stands compared to the recent high and low prices. The formula for %K is:
%K = [(Current Close – Lowest Low) / (Highest High – Lowest Low)] x 100
Current Close: The most recent closing price of the asset.
Lowest Low: The lowest price over a specific period (usually 14 days).
Highest High: The highest price over the same period.
For example, if a stock has a 14-day high of $50, a low of $40, and closes at $48, the %K value would be:
%K = [(48 – 40) / (50 – 40)] x 100 = 80%
%D Line: This is a simple moving average (SMA) of the %K line, usually calculated over three periods. The %D line helps smooth out the %K line, making it easier to spot buy or sell signals.
For example, if the last three %K values were 70, 80, and 85, the %D line would be:
% D = (70 + 80 + 85) / 3 = 78.33
How To Interpret The Stochastic Oscillator
If the oscillator is above 80, it means the market is overbought – prices have likely risen too fast, and a pullback might be coming.
If it’s below 20, the market is oversold – prices have dropped quickly, and a bounce back could happen soon.
Buy and Sell Signals:
A buy signal happens when the %K line crosses above the %D line, especially when both are below the oversold level (below 20).
A sell signal happens when the %K line drops below the %D line, particularly when both are above the overbought level (above 80).
How Traders Use It:
Traders often watch for “divergence” between the oscillator and price movements. For example, if prices are making new highs but the stochastic oscillator isn’t, it could mean momentum is fading, and a reversal might be on the horizon.
The standard setting for the stochastic oscillator is 14 periods (days), but traders can tweak this. A shorter period makes the oscillator react more quickly to price changes, but it might generate more false signals. A longer period will smooth things out but could delay signals.
Limitations:
The stochastic oscillator works well in range-bound markets, where prices move between set levels. In strong trending markets, it can give false signals because prices can stay in the overbought or oversold zones for a long time without reversing.
Since it measures momentum based on past prices, the stochastic oscillator is a lagging indicator. It follows price movements rather than predicting them, so it’s not always useful for forecasting.
Also, like any indicator – it’s not infallible. Further analysis may be required to confirm your thinking.
Why Traders Like The Stochastic Oscillator
Traders like using the stochastic oscillator for a variety of reasons, mainly because it helps them spot momentum shifts, figure out when an asset is overbought or oversold, and catch potential reversals in the market.
Here are 10 reasons why this tool is so popular:
1: Pinpoints Overbought And Oversold Levels
One of the stochastic oscillator’s main attractions is its ability to tell traders when the market is getting too “stretched.”
- When the oscillator is above 80, it’s saying the market is likely overbought, meaning prices have risen a lot, maybe too quickly, and a dip could be coming.
- When it’s below 20, the market is considered oversold, signaling that prices might have fallen too much and that a rebound could be around the corner.
Traders love this because it gives them a heads-up about when to watch for price reversals.
2. Generates Simple Buy And Sell Signals
Another reason traders are drawn to the stochastic oscillator is that it gives clear, easy-to-read signals.
- When the %K line crosses above the %D line (especially when they’re both in the oversold zone), it’s a buy signal, a cue that momentum might shift upward.
- On the flip side, when the %K line drops below the %D line in the overbought zone, it’s a sell signal; it’s time to consider getting out before prices fall.
These crossovers provide traders with straightforward entry and exit points, making the tool pretty user-friendly.
3. Tracks Momentum In The Market
The stochastic oscillator is also brilliant at showing the momentum behind price movements. In an uptrend, prices tend to close near their high, and in a downtrend, near their low.
This tool helps traders visualize that momentum, giving them a feel for whether a trend is strengthening or losing steam.
4. Works Well in Range-Bound Markets
It’s especially handy when the market is moving sideways or within a range, bouncing between support and resistance levels.
In these kinds of markets, the stochastic oscillator can help traders spot when prices are getting close to an extreme (either overbought or oversold) and are likely to reverse.
5. Spotting Divergences For Reversals
Traders also like the stochastic oscillator because it can give early warning signs of a reversal through something called divergence.
- Bullish divergence happens when prices are making new lows, but the oscillator isn’t. This can signal that the downtrend is running out of steam, and a rebound might be on the way.
- Bearish divergence is the opposite; prices are making new highs, but the oscillator isn’t keeping up, which could mean the uptrend is weakening.
Divergences are like a little nudge telling traders to keep an eye out for a potential change in direction.
6. Customizable To Fit Different Trading Styles
One of the significant advantages of the stochastic oscillator is that it’s adaptable. Traders can adjust its settings (like the number of periods it looks back on) to match their style:
- Short-term traders might use a shorter period, like five days, to get more sensitive signals that react quickly to price changes.
- Longer-term traders might go longer, like 21 days, to smooth out the noise and focus on more significant trends.
This flexibility makes the stochastic oscillator useful for a wide range of trading strategies.
7. Works Well With Other Indicators
The stochastic oscillator is often used alongside other technical tools to give traders more confidence in their decisions. For instance, it can be combined with:
- Moving averages to confirm the trend direction.
- Support and resistance levels to help spot where a reversal might happen.
- Indicators like the Relative Strength Index (RSI) or MACD for additional confirmation of signals.
Using it with other tools helps reduce the risk of acting on a false signal.
8. Easy to Use
Even though it sounds technical, the stochastic oscillator is simple to use. Its visual representation, lines between 0 and 100 with overbought and oversold zones, makes it easy to see what’s happening.
The clear buy and sell signals from line crossovers mean that even beginners can quickly get the hang of it.
9. Helps Time Reversals
In volatile markets, timing is everything, and the stochastic oscillator helps traders spot when momentum is shifting before it’s obvious in the price.
This gives traders a bit of an edge in entering or exiting a trade at just the right moment.
10. Works Across Different Markets
The stochastic oscillator isn’t just for stocks; it works across all kinds of financial markets like forex, commodities, and even cryptocurrencies.
This versatility makes it a go-to tool for many traders, no matter what asset they’re trading.
Applying The Stochastic Indicator
I typically avoid altering the standard settings on indicators, but I make an exception when it comes to the stochastic. Why? Because I’m looking for day or swing trading opportunities, not position trades.
Over the years, I’ve experimented with many stochastic settings. Like others in the trading community, I’ve settled on 14, 3, and 3 as my go-to settings when trading off the 1 HR and 4 HR timeframes, my preferred charts for day/swing trading strategies.
1 HR Timeframe
The below 1 HR chart of Sasol, a South African stock that recently experienced significant price action, is a perfect textbook example of how I’d use the stochastic as a day trader, especially when I combine it with looking out for price action illustrated by smoothed Heikin Ashi candlestick formations.
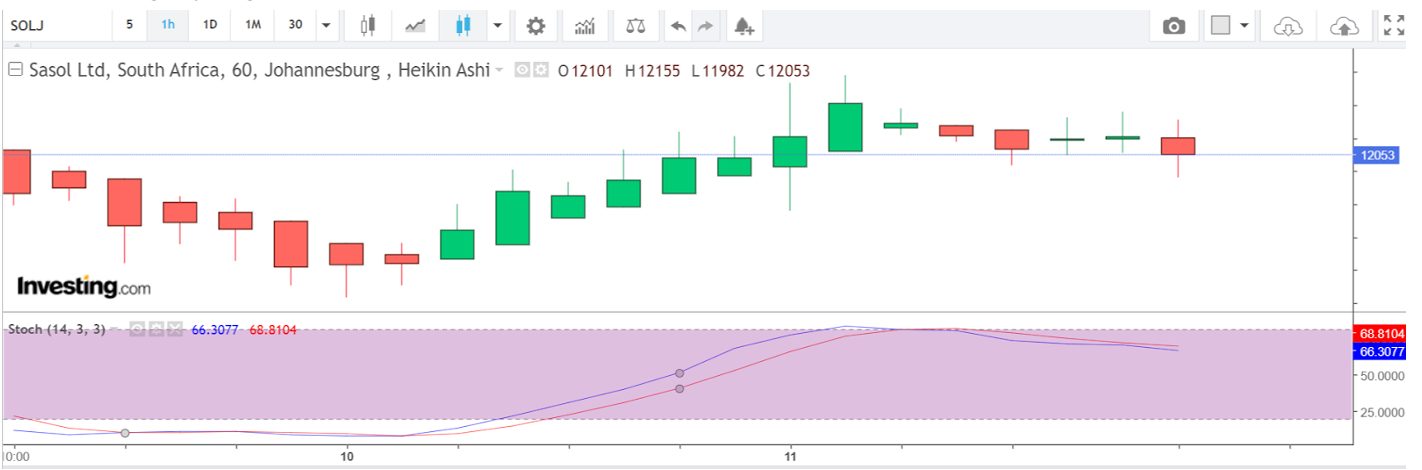
There are three stages on the above 1 HR chart worth noting:
- During the bearish down phase, the lines narrowed, eventually reached, and remained glued to the oversold zone (below 20), indicating a ranging market.
- During the bullish up phase, the lines crossed, expanded, crossed the median 50 line and eventually reached the overbought zone (over 80) as the lines converged.
- During the next phase, the lines crossed, but the stoch oscillator didn’t necessarily generate a signal to encourage us to take a trade. We should always look to avoid these ranging conditions.
4 HR Timeframe
On the below 4 HR chart, we can see alternative opportunities as a swing trader. The signals from the stochastic can be more defined on higher timeframes, although less frequent, and you may enter later when the Heikin Ashi candlestick formations align with the stoch signals.
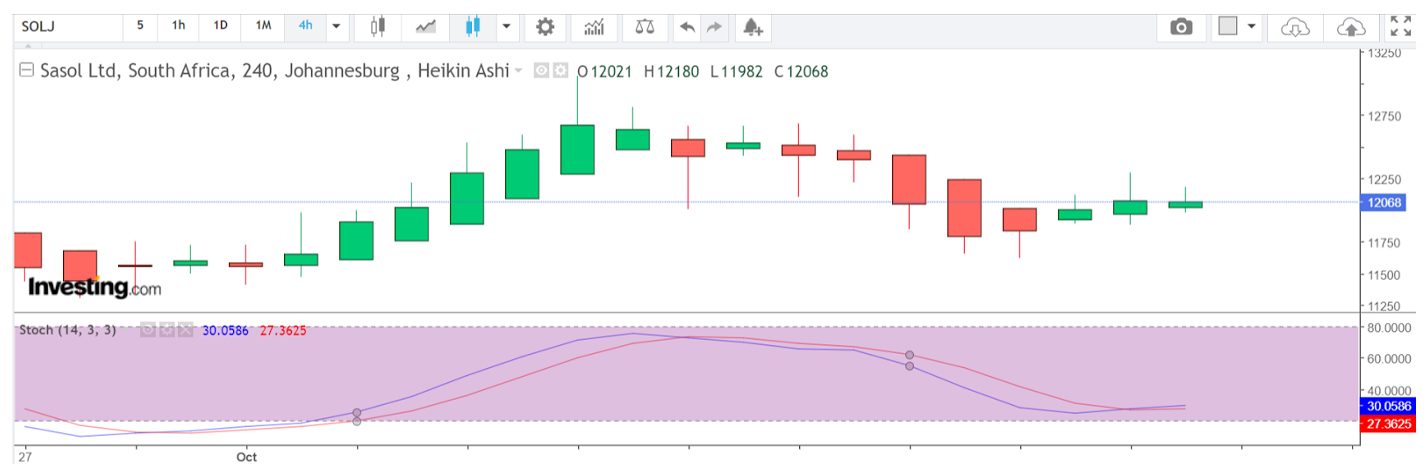
Using Heikin Ashi analysis, I saw three Dojis as price ranged. Then, the inverted hammer developed with its bullish formation after the stock lines had crossed.
I then waited for confirmation on the following 4 HR candle before entering long. I exited when the bearish hammer formed and the stoch lines crossed again.
Bottom Line
Short-term traders are drawn to the stochastic oscillator because it gives clear insights into momentum shifts and potential price reversals.
It’s easy to read, customizable and works well in range-bound markets, but it’s also effective across various types of assets.
The straightforward buy and sell signals and the ability to spot overbought and oversold levels make it a favourite tool in many trading strategies.
However, as with all day trading indicators – it does not guarantee results
Article Sources
The writing and editorial team at DayTrading.com use credible sources to support their work. These include government agencies, white papers, research institutes, and engagement with industry professionals. Content is written free from bias and is fact-checked where appropriate. Learn more about why you can trust DayTrading.com