How To Use TradingView: A Beginner’s Guide


Since its launch in 2011, TradingView has amassed over 300 million users worldwide, establishing itself as one of the fastest-growing platforms for advanced charting and idea sharing. But how do you make the most of its powerful features?
Based on real-world use and testing, this guide to TradingView for beginners walks you through everything from setting up your first chart to using advanced tools like indicators, alerts, and Pine Script.
Top Brokers With TradingView
-
1
 Interactive Brokers
 -
2
 OANDA USCFDs are not available to residents in the United States.
 -
3
 FOREX.com
 -
4
 CEX.IO
See more top brokers for TradingView
Getting Started With TradingView
1. Signing Up And Choosing The Right Plan
First things first: you need an account. Here’s how to set it up:
- Go to TradingView.com and hit the “Sign Up” button at the top right.
- You’ll see options to sign up using email, Google, Facebook, or other methods. Pick your favorite and create an account.
Once you’re in, you’ll need to decide on a plan:
- Free Plan: Great for beginners, but you’ll see ads and some features like multiple charts are limited.
- Essential: Removes ads and adds tools like multiple indicators and custom time intervals.
- Plus: Adds more features like advanced alerts and charts on multiple devices.
- Premium: Full access to everything, including priority support and unlimited alerts.
There are also two professional plans for advanced traders:
- Expert: Provides more tools, including charts, indicators, historical bars, alerts and parallel chart connections.
- Ultimate: Offers an even greater range of tools, including 16 charts per tab, 50 indicators per chart, and 1,000 alerts.
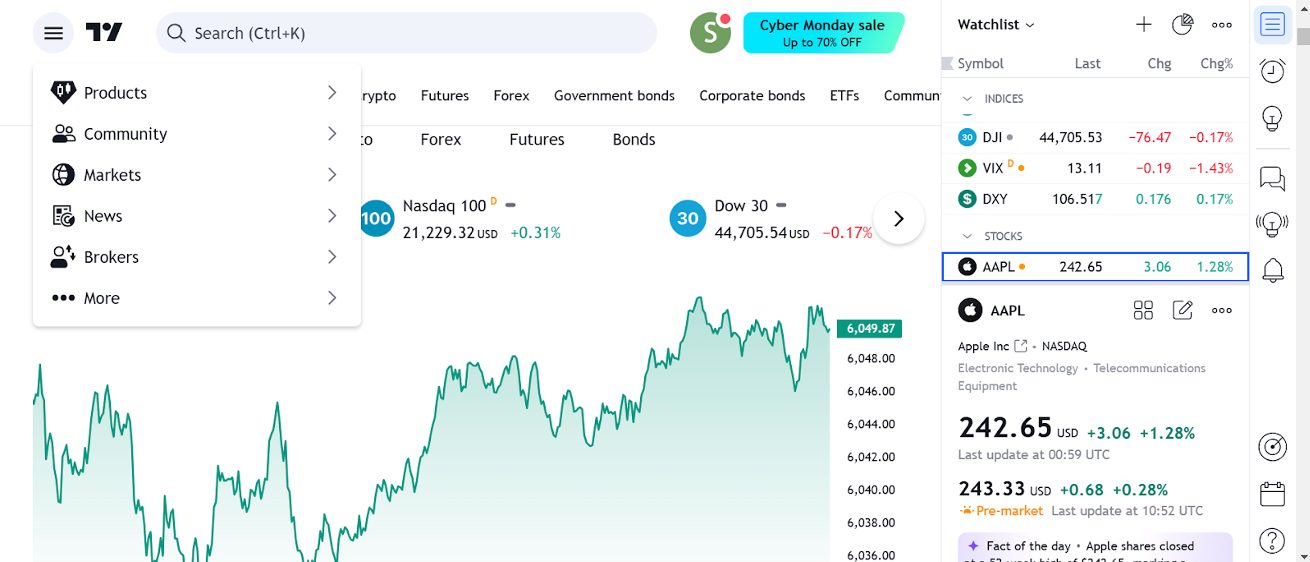
2. Navigating The Interface
TradingView’s interface might look complex at first glance, but it’s designed to be intuitive. Here’s a quick tour:
- Main Toolbar: Options for switching between markets, adding indicators, and saving your work.
- Left Sidebar: Packed with drawing tools, like trendlines, Fibonacci retracements, and more.
- Chart Area: Where you’ll view and analyze price data.
- Right Sidebar: Watchlists, alerts, and a chat feature to connect with other traders.
- Bottom Bar: Pine Script coding, alerts log, and your trade history.
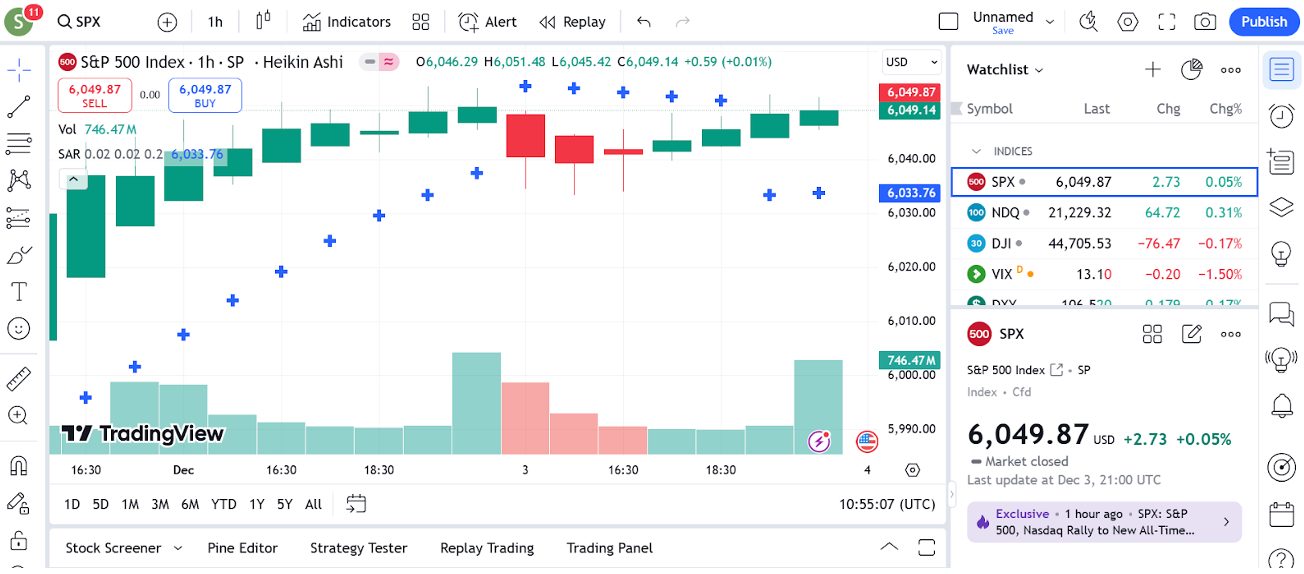
3. Configuring Your First Chart
Here’s how to create your first chart and customize it like a pro:
- Search for An Asset: Use the search bar at the top to find a stock, forex pair, crypto, or any other asset you want to analyze.
- Choose A Chart Type: By default, you’ll see a candlestick chart, but you can switch to line, bar, or Heiken Ashi using the top toolbar.
- Customize Timeframes: Select your preferred timeframe, from 1 minute to monthly charts.
- Add Indicators: Click the “Indicators” button at the top to apply tools like Bollinger Bands.
- Save Your Chart: Hit the “Save” icon (floppy disk) so you can revisit your work later.
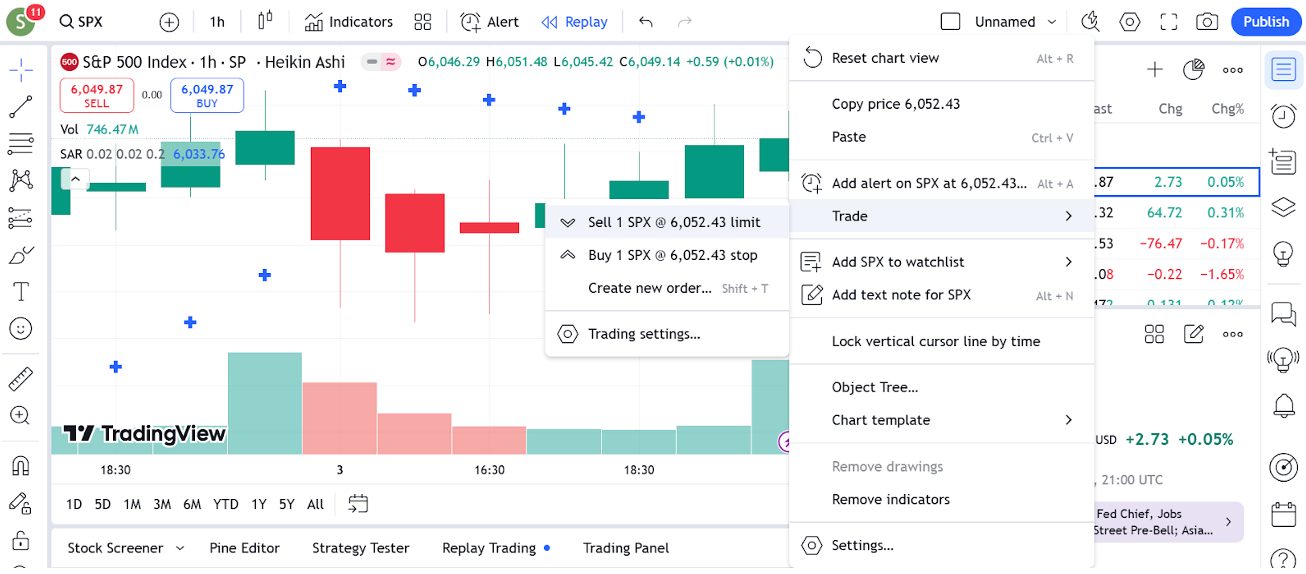
4. How To Place A Trade
- Right-click on your chart where you want to execute a trade.
- Select “Trade” and choose between “Buy” or “Sell.”
- A trade window will appear where you can:
- Enter the lot size or quantity.
- Set take-profit and stop-loss levels directly on the chart.
- Review the current price and fees.
Using The Order Panel
You can also place trades via the Order Panel for more precision:
- Choose the order type:
- Market Order: Execute at the current price.
- Limit Order: Set a specific price to enter the trade.
- Stop Order: Enter once a predefined level is hit.
- Click Buy or Sell to confirm your order.
Understanding The Tools
Let’s explore the tools that make TradingView such a powerful platform for short-term traders.
Chart Types And Customizations
TradingView offers a variety of chart types to suit different trading styles. Here’s a quick rundown:
- Candlestick Charts: These are the most popular among traders for showing price action.
- Line Charts: Great for identifying long-term trends but less relevant for day traders.
- Bar Charts: Similar to candlesticks, but focus on highs, lows, opens, and closes.
- Heikin Ashi: Smooths out price action for easier trend analysis (my preferred).
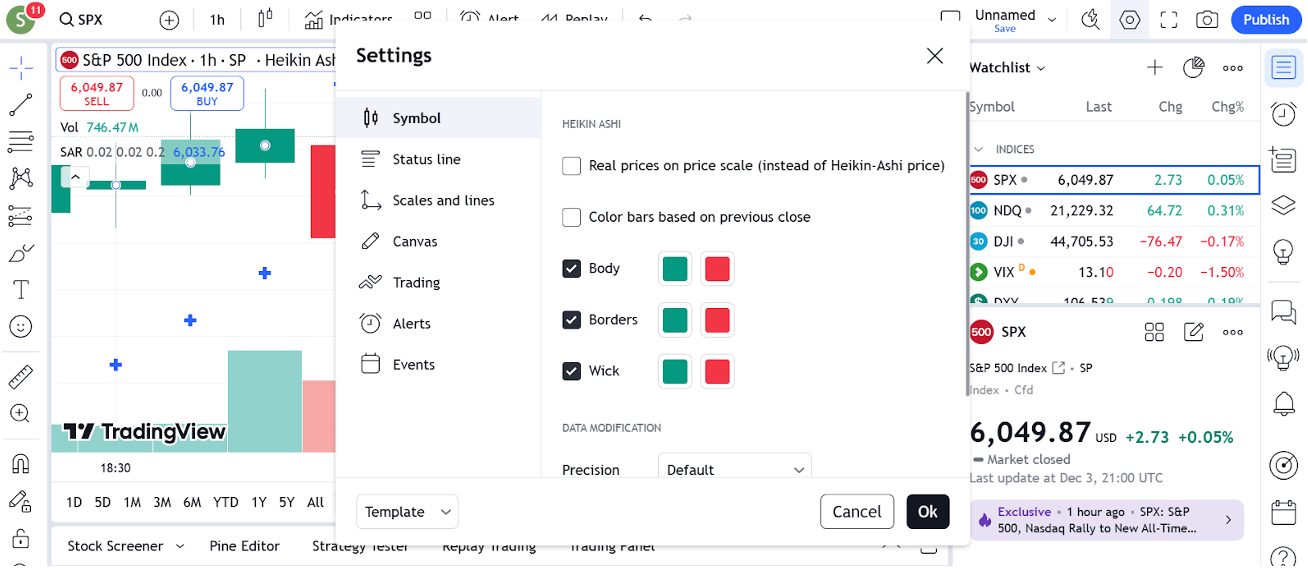
Customizing Your Charts
- Right-click on the chart area and select “Settings.”
- Use the menu to adjust colors, scale types, and background styles.
- You can also drag and resize axes to focus on specific price ranges.
Live Chart
Indicators, Drawing Tools, And Templates
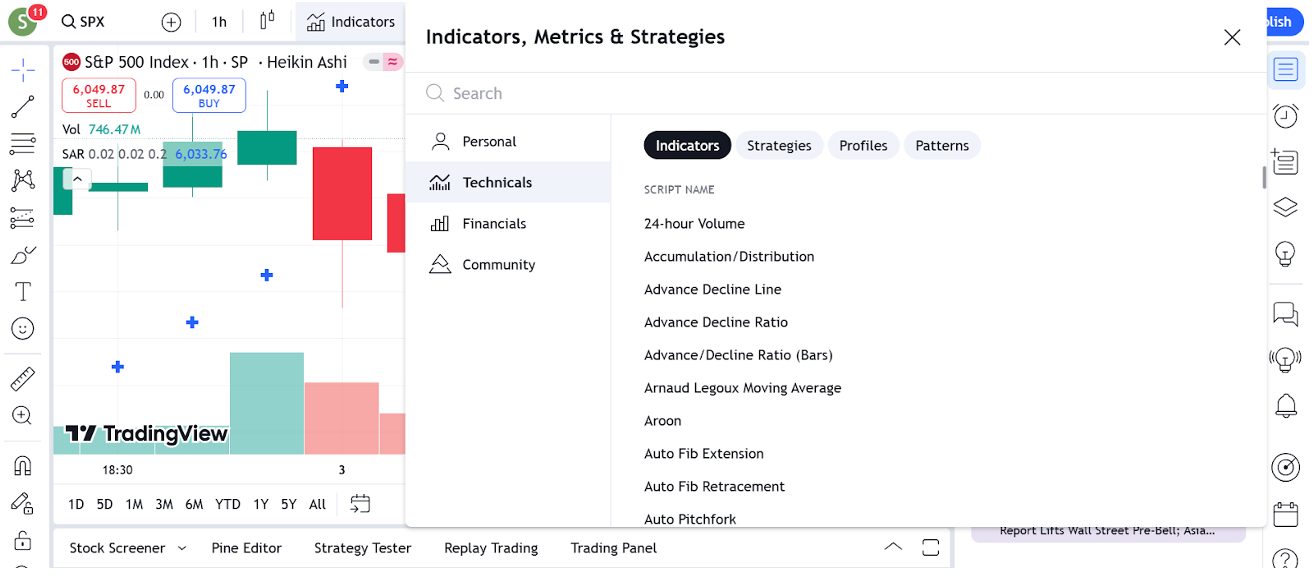
Indicators
TradingView boasts over 100 built-in indicators and thousands of custom scripts.
- Click the “Indicators” button on the top toolbar to add indicators.
- Popular ones with day traders include Moving Averages, RSI, MACD, and Bollinger Bands.
- Combine indicators to create a unique strategy, but don’t overdo it; too many can clutter your chart.
TradingView’s VWAP Auto Anchored can be very handy for day traders because it automatically anchors to key points like session opens, giving you a dynamic support/resistance line for intraday momentum and mean-reversion setups without constant manual resets.Just remember it can lag or pick less relevant pivots in fast markets, so use it alongside volume, RSI/MACD or trendlines – and consider manual anchoring if you want finer control.
Drawing Tools
Located on the left sidebar, these tools help you analyse and annotate charts.
- Trendlines: Draw support/resistance levels or channels.
- Fibonacci Tools: Ideal for spotting retracement levels.
- Text and Shapes: Add notes or highlight key areas.
Templates
If you find a setup that works for you, save it as a template:
- Set up your indicators and drawing tools.
- Click on the dropdown near the “Indicators” button and select “Save Indicator Template.”
- Load your template with a single click next time.

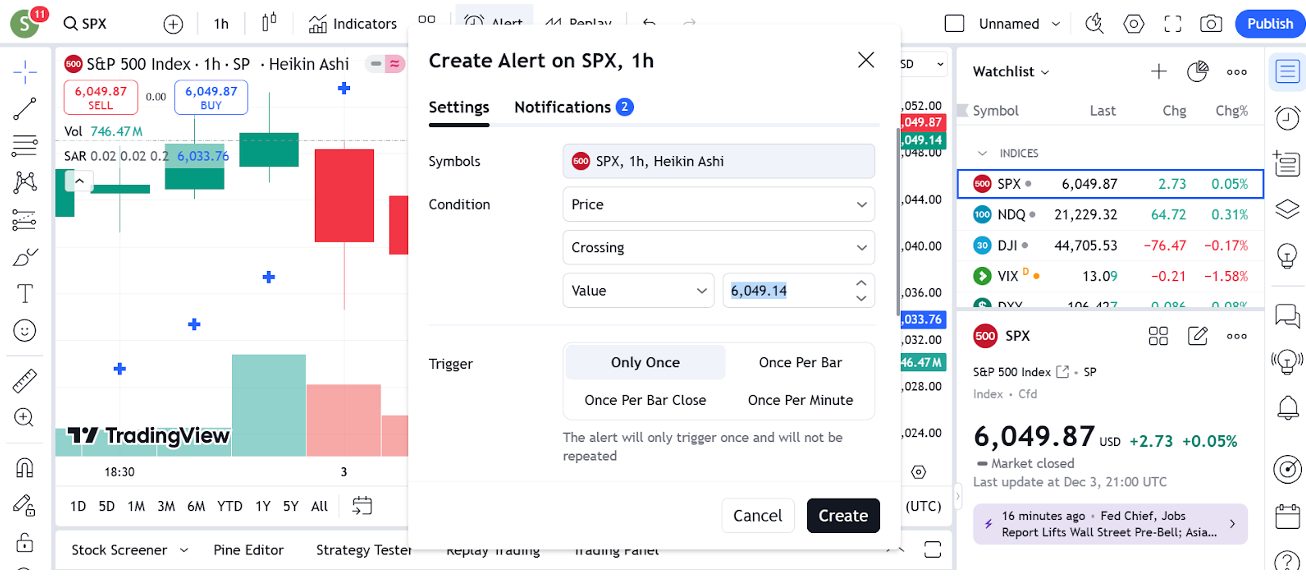
Alerts
Alerts are one of TradingView’s best features, ensuring you never miss a market move.
Setting Up Alerts
- Right-click on your chart and select “Add Alert.”
- Customize the alert:
- Condition: Choose price, indicator value, or trendline breakouts.
- Frequency: Decide if it triggers once or every time the condition is met.
- Notification Type: Get alerts via email, SMS, or in-app pop-ups.
Managing Alerts
All your alerts are stored in the “Alerts” tab on the right sidebar. You can edit, pause, or delete them at any time.
Use alerts with custom scripts or strategies for automated monitoring of complex conditions.
Mastering Analysis On TradingView
Let’s explore how to leverage the platform for technical analysis, integrate your own day trading strategies, and even dabble in Pine Script to create custom tools.
Technical Analysis Using Built-In Tools
TradingView’s arsenal of built-in tools makes technical analysis a breeze. Here’s how to get started:
Indicators And Oscillators
- Use indicators like Moving Averages, RSI, and MACD for trend analysis and momentum tracking.
- To add one, click “Indicators” at the top and search for the tool you need.
Drawing Tools
- Highlight key price levels with horizontal lines and trendlines.
- Map retracements using Fibonacci tools; ideal for spotting support and resistance.
- Use shapes and text annotations to mark breakout zones or price patterns.
Patterns And Prediction Tools
- Identify common chart patterns, like head and shoulders, triangles, or wedges, manually or with automated pattern recognition.
- Try tools like Bars Pattern to predict potential price movements based on historical behaviour.
Integrating Your Own Strategies
If you have a specific trading strategy, TradingView makes it easy to bring it to life:
Using Custom Indicator Combinations
- Layer multiple indicators and tweak their settings. For example, you can combine Bollinger Bands with Moving Averages to confirm trends.
- Save your custom combination as an indicator template for future use.
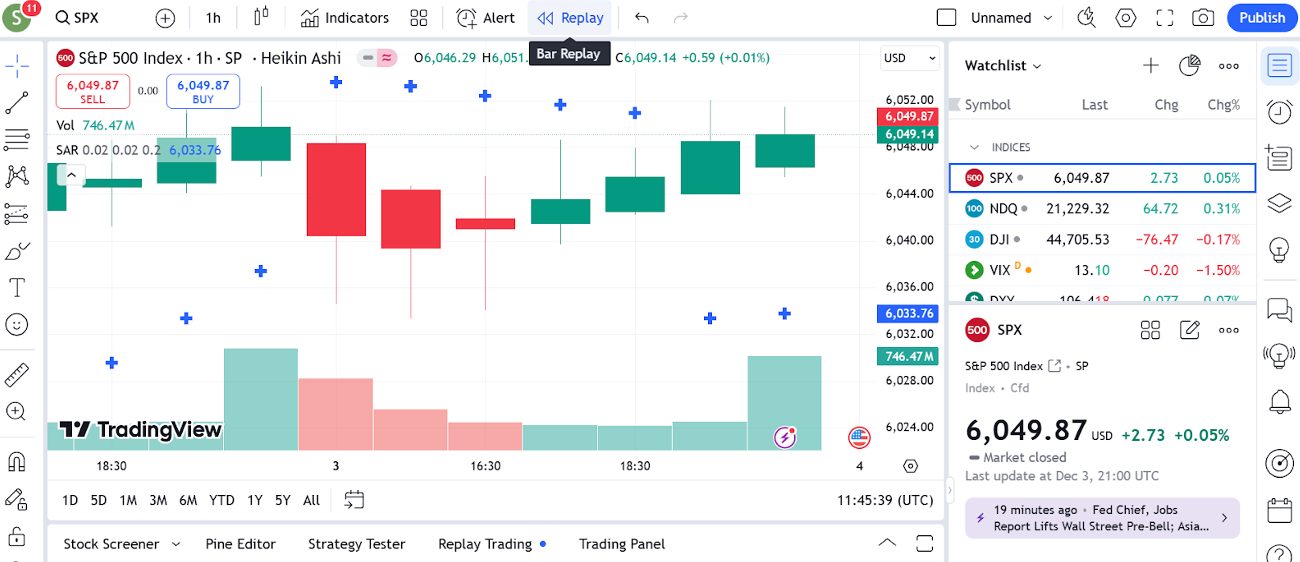
Backtesting Your Strategy
- Analyze past price action to see how your strategy performs under different conditions.
- Use replay mode (available in Pro plans) to simulate market movements and refine your approach.
Using Scripts And The Pine Script Editor
Want to take your analysis to the next level? Enter Pine Script, TradingView’s programming language, to create custom indicators and strategies.
What Is Pine Script?
- A lightweight and beginner-friendly coding language designed for financial analysis.
- You can use it to automate repetitive tasks, create personalized indicators, or build advanced trading systems.
Getting Started With Pine Script
- Open the Pine Editor at the bottom of your screen.
- Start with a template or explore the vast library of scripts the community shares.
- Write your own script by defining conditions, calculations, and visual outputs.
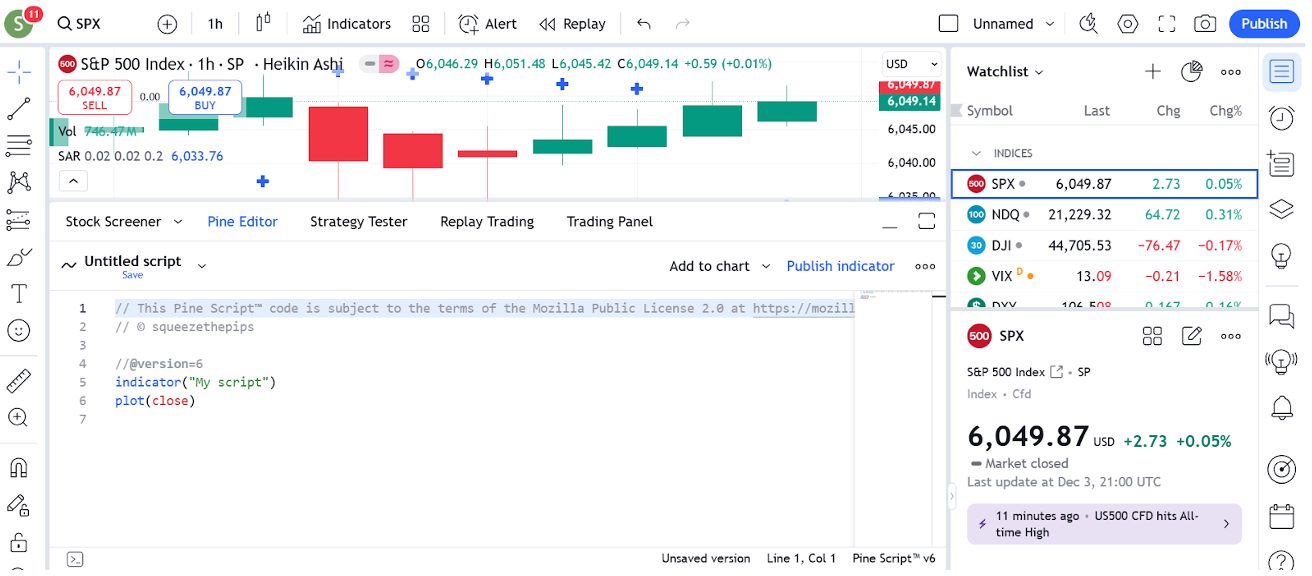
Example: Simple Moving Average Script
Pine script
Copy code
//@version=5
indicator(“Simple Moving Average”, overlay=true)
length = input(14, title=”SMA Length”)
sma_value = ta.sma(close, length)
plot(sma_value, color=color.blue, title=”SMA”)
- This script plots a 14-period Simple Moving Average on your chart.
- Customize the input to tweak the length or colour.
Testing And Sharing Your Scripts
- Apply your script to a chart to test it in real-time.
- Share your creation with the TradingView community of ideas, or keep it private.
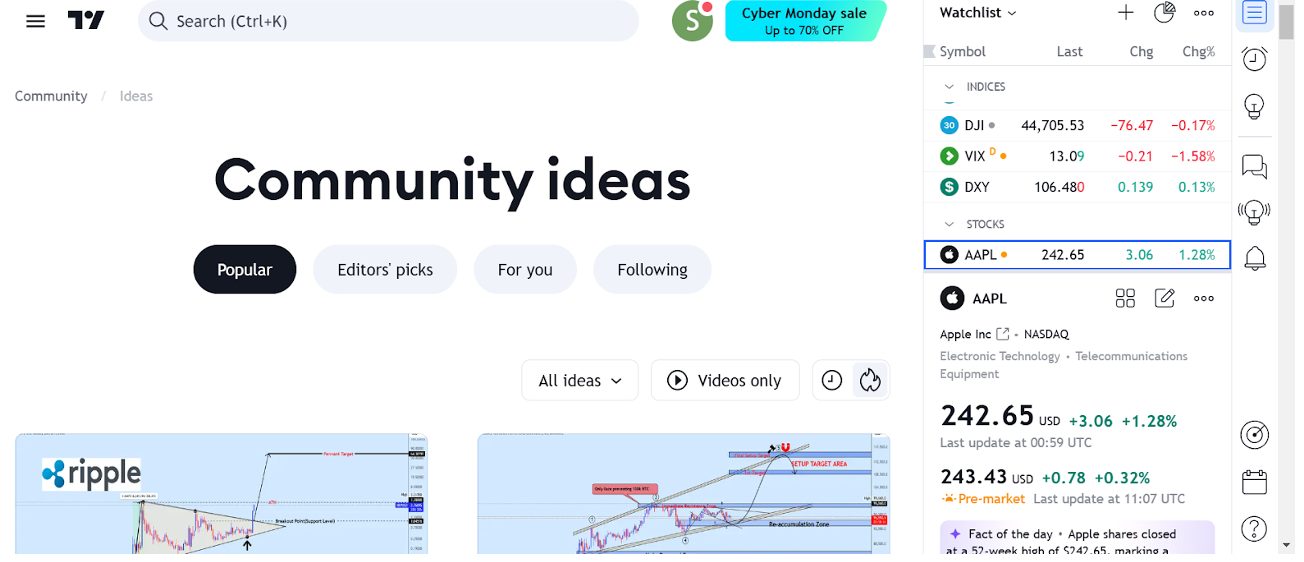
Exploring The Community
TradingView is a vibrant hub where traders share insights, ideas, and strategies. This is partly what’s driven its meteoric rise among active traders.
How To Follow Traders And Explore Ideas
Finding Traders To Follow
- Go to the Ideas tab in the main menu to browse insights from other traders.
- Use the “Popular” or “Editor’s Pick” sections to discover contributors who consistently publish high-quality analyses.
- Check out their profiles to see their past work, stats, and the types of markets they specialize in.
Exploring Shared Ideas
- In the Ideas section, filter by asset class (stocks, forex, crypto, etc) or specific instruments like BTC/USD or EUR/USD.
- Sort ideas by “Most Popular” or “Latest” to find what’s trending or fresh.
- Each idea includes a detailed chart, analysis, and often a discussion comment section.
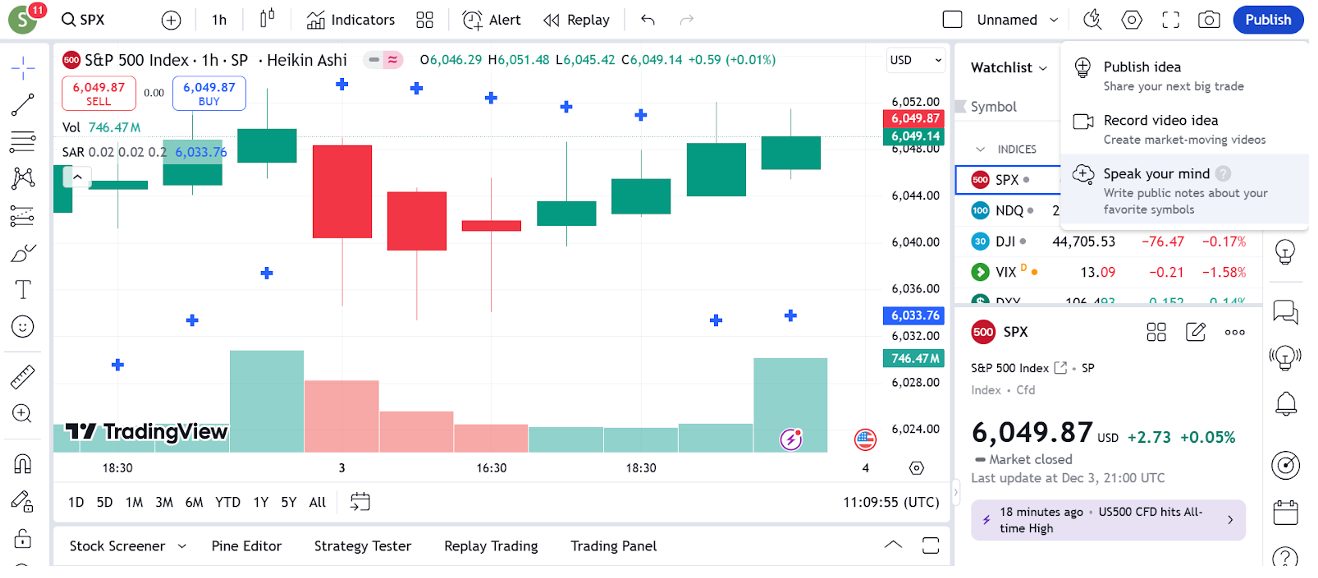
Publishing Your Own Charts And Strategies
Sharing your work is a great way to document your thought process and get feedback from the community.
How To Publish A Chart
- Once your chart is ready, click “Publish” at the top right of the screen.
- Add a title and description explaining your idea.
- Choose the visibility:
- Public: Share with the entire community.
- Private: Keep it for yourself or share it via a direct link.
My Tips For Creating Impactful Posts
- Use clean charts with minimal clutter; highlight key levels and patterns.
- Explain your analysis: What are you seeing, and why does it matter?
- Include hashtags (eg #crypto, #forex) to make your idea more discoverable.
Publishing Strategies Or Indicators
- If you’ve built a custom indicator or strategy in Pine Script, you can share it with others.
- Click “Publish Script” in the Pine Editor to share your work.
- Be sure to include instructions or explanations for users who might download it.
Engaging With Forums And Groups
Forums And Chats
- The Chat Section on the right sidebar lets you join public or private chats.
- Engage in group discussions on topics like forex trading, crypto markets, or strategy building.
Groups And Streams
- Some users host live streams where they analyse markets in real-time. Watch these sessions to learn directly from experienced traders.
- Join interest-based groups to find traders who share your niche, like options trading or algorithmic trading strategies.
Commenting On Ideas
- If you see an interesting chart or analysis, don’t hesitate to leave a comment. Asking questions or sharing your perspective is a great way to start meaningful discussions.
- Engaging with others, sharing your insights, and learning from experienced traders will improve your skills and make you feel part of a global trading ecosystem.
FAQ
What Is TradingView?
TradingView is a web-based platform packed with tools for charting, analyzing, and sharing trading ideas.
Whether a beginner learning the ropes or a savvy trader, this platform is your all-in-one toolkit for the markets.
Here’s why I, and a growing number of other active traders, love it:
- User-Friendly Interface: No need to be a tech wizard. TradingView makes everything look sleek and intuitive.
- Accessible Everywhere: It’s browser-based, so you only need an internet connection. Plus, there’s an app for when you’re on the go.
- Community-Powered: TradingView isn’t just a tool; it’s a community. Traders from all over the world share their insights, strategies, and chart ideas here.
Recommended Reading
Article Sources
- TradingView
- TradingView Plans
- TradingView Public Library
- TradingView Pine Script
- TradingView Community Ideas
- TradingView Ideas
- TradingView Reddit
The writing and editorial team at DayTrading.com use credible sources to support their work. These include government agencies, white papers, research institutes, and engagement with industry professionals. Content is written free from bias and is fact-checked where appropriate. Learn more about why you can trust DayTrading.com