Relative Strength Index (RSI)


The Relative Strength Index (RSI) is a popular tool in technical analysis used by active traders to gauge the momentum of an asset’s price.
Created by J. Welles Wilder in 1978, RSI helps traders figure out if a stock or other asset is overbought (which could suggest a price drop) or oversold (which might hint at a price increase). Essentially, it tracks the speed and changes in price to highlight potential turning points.
Quick Introduction
- The RSI measures price momentum on a scale of 0 to 100, indicating overbought (above 70) or oversold (below 30) conditions, helping traders identify potential reversals.
- The RSI can spot divergences between the price and the indicator, signaling potential trend reversals before they happen in fast-moving markets.
- Its easy interpretation and adaptability across various asset classes make the RSI popular among both beginner and experienced traders.
- The RSI works well with other day trading indicators like Moving Averages, Bollinger Bands, or MACD to create a more complete trading strategy.
Best Brokers For RSI Analysis Trading
These 4 brokers house the RSI indicator in their trading software and are our experts' top picks for day traders:
-
1
 OANDA USCFDs are not available to residents in the United States.
 -
2
 FOREX.com
 -
3
 xChief
 -
4
 InstaTrade
What Is The RSI?
The Relative Strength Index, or RSI, can help you identify an instrument’s relative strength in the market.
The relative strength is measured in relation to the period (or setting) you select. So, if you leave your RSI settings on the standard 14 period, which the creator built it to work best on, then on a daily timeframe, you’re measuring the price movements’ relative strength over those 14 days.
If you only allowed me one indicator (other than price) to base all my trading decisions, then it’d be the RSI.Why? Because as an oscillator it indicates momentum, the strength of the trend, possible stop-reverse turning points, volatility, and oversold and overbought conditions.
How RSI Works
RSI measures the strength of recent price changes. It compares the average of the asset’s gains and losses over a set period (often 14 periods, which could be days, hours, etc.) and turns this into a number that moves between 0 and 100.
Now, let’s look at the math, but bear in mind that, due to the wonders of modern technology, you don’t have to calculate these mathematical equations by hand to use the RSI on your chart because the indicator you select from your platform’s charting package is already primed for use.
So, we completely understand if you want to bypass this section and fast-forward to the trading examples.
How It’s Calculated
Find the Average Gain and Loss: For each of the last 14 periods, separate the positive price changes (gains) from the negative ones (losses):
- Average Gain = (Sum of gains over the past 14 periods) / 14
- Average Loss = (Sum of losses over the past 14 periods) / 14
Calculate Relative Strength (RS): The RS is simply the ratio of the average gain to the average loss:
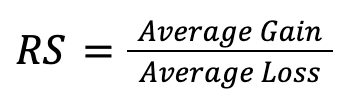
Calculate the RSI: Once you have RS, plug it into the RSI formula to get a value between 0 and 100:
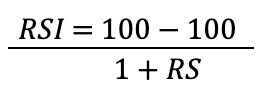
Lower RSI values mean the price has seen more losses recently, while higher values mean more recent gains.
How To Interpret The RSI
- Overbought (>70): If the RSI is over 70, it might indicate the asset has been climbing too quickly and could be due for a pullback.
- Oversold (<30): When RSI drops below 30, it suggests the asset might have fallen too much and could be ripe for a rebound.
- Neutral (Around 50): An RSI around 50 indicates a balance between buying and selling pressure; there’s no strong trend in either direction.
Adjusting RSI For Smoother Results
After the first 14 periods, the RSI calculation uses a “smoothed” formula to avoid reacting too dramatically to one-off price moves. It updates the average gain and loss over time like this:
- New Average Gain = (Previous Average Gain * 13 + Current Gain) / 14
- New Average Loss = (Previous Average Loss * 13 + Current Loss) / 14
This smoothing makes RSI more stable and less sensitive to short-term volatility.
Example
Let’s say a stock’s price changes over 14 days as follows:
Gains: 3, 2, 1, 4, 5
Losses: 1, 2, 3, 2, 1
- Average Gain = (3 + 2 + 1 + 4 + 5) / 14 = 1.07
- Average Loss = (1 + 2 + 3 + 2 + 1) / 14 = 0.64
- RS = 1.07 / 0.64 ≈ 1.67
- RSI = 100 – (100 / (1 + 1.67)) ≈ 62.6
This RSI value of 62.6 shows bullish momentum, but the stock is not yet in overbought territory.
RSI In Different Market Conditions
- Trending Markets: In a strong uptrend, RSI can stay above 70 for a long time, signaling strong buying momentum. Conversely, the RSI might stay below 30 in a downtrend, reflecting persistent selling pressure.
- Reversals: If the RSI crosses above 30, it could signal a bullish reversal. Similarly, if it falls below 70, it might signal a bearish reversal.
RSI Divergence
- Bullish Divergence: If the price is making lower lows, but the RSI is making higher lows, this could signal a weakening downtrend and a potential upward reversal.
- Bearish Divergence: If the price is making higher highs, but the RSI is showing lower highs, it could indicate that the uptrend is losing steam, possibly leading to a reversal.
Why Do Traders Like The RSI?
Traders like the Relative Strength Index (RSI) because it provides a quick, straightforward way to assess the momentum of an asset’s price and helps identify potential entry and exit points.
Here are 10 reasons why RSI is so popular among traders:
1. Easy to Understand
The RSI is straightforward: it ranges from 0 to 100, with clear benchmarks at 30 and 70 for oversold and overbought conditions. This simplicity allows even beginner traders to interpret the indicator and make decisions quickly.
2. Identifying Overbought and Oversold Conditions
RSI helps traders spot when an asset may be overbought or oversold:
- Above 70: The asset could be overbought and due for a correction or pullback.
- Below 30: The asset might be oversold, suggesting a possible rebound or buying opportunity.
These signals can help traders decide when to buy or sell or when to hold off on new trades.
3. Momentum and Trend Confirmation
RSI is a momentum oscillator, so it helps traders gauge the strength of a trend. For example, if the RSI stays above 50 during an uptrend, it confirms the strength of that upward momentum.
This confirmation can give traders confidence in continuing to hold their positions.
4. Reversal Signals
Traders use RSI to spot potential reversals in price trends. When the RSI crosses above 30 from below, it could indicate a bullish reversal (a signal to buy). When it drops below 70 from above, it may suggest a bearish reversal (a signal to sell).
These reversal points help traders time their trades better.
5. Versatility Across Different Markets
RSI works well across different asset classes and time frames, including stocks, forex, cryptocurrencies, and commodities.
Traders can adjust the RSI period (e.g., from 14 to 9 or 20) to suit their trading style, for example, short-term trading strategies.
6. Divergence Signals
RSI is effective for identifying divergence, which occurs when the price of an asset and its RSI move in opposite directions. For example:
- Bullish Divergence: If the price makes lower lows but the RSI makes higher lows, this signals a potential upward reversal.
- Bearish Divergence: If the price makes higher highs but the RSI forms lower highs, it may indicate a potential downward reversal.
Divergence helps traders anticipate trend changes before they happen.
7. Combines Well with Other Indicators
Traders, including myself, often pair RSI with other indicators like moving averages, Bollinger Bands, or MACD to create a more comprehensive trading strategy.
RSI can serve as a confirmation tool, providing extra confidence in trades initiated by other signals.
8. Helps Manage Risk
By identifying overbought or oversold conditions, RSI can prevent traders from entering trades at the wrong time, helping them avoid unnecessary risks.
For example, if a stock’s RSI shows overbought conditions, a trader might hold off on buying, avoiding buying at a peak.
9. Customizable
RSI is customizable to fit various trading strategies. Traders can adjust the period (e.g., from 14 to 9 for short-term strategies) or use RSI with different time frames, like hourly or weekly charts.
This flexibility makes it useful for both day traders and long-term investors.
10. Widely Used and Trusted
RSI has existed since 1978 and remains one of the most widely used technical indicators. Many active traders trust it because it has stood the test of time, proving effective in various market conditions.
Limitations Of RSI
- False Signals: In solid trends, RSI might give misleading overbought or oversold readings, as trends can last longer than expected.
- Lagging Indicator: Since RSI is based on past price data, it may not always react quickly enough to sudden market shifts.
Using The RSI
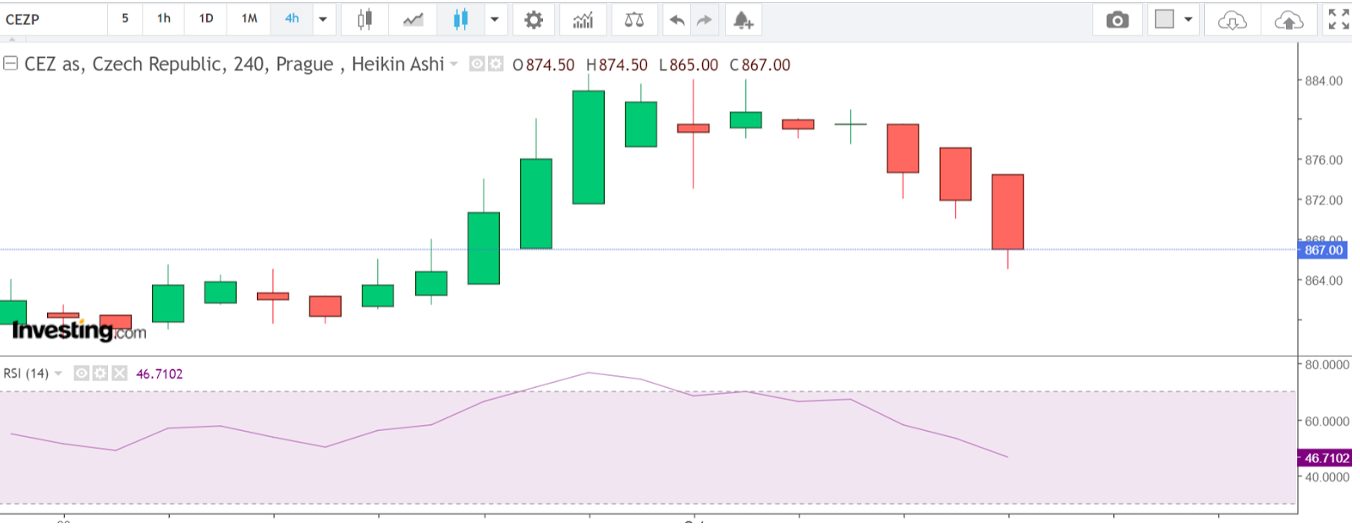
In the above example of CEZP, a stock quoted on the Prague Stock Exchange, we’re using Heikin Ashi candles (bars) to discover price action, combined with the RSI as a single indicator to determine the relative strength of the trend’s momentum, volatility and overbought conditions.
Heikin Ashi Analysis
We can see two distinct periods: the initial strong bullish conditions quickly followed by the bearish conditions, during which the bears eventually dominated the bulls.
As the bullish momentum gained, the 4HR HA candles eventually became complete and solid with upward shadows (wicks). The bullish price action was a classic, three-soldier formation, a textbook example of three candles/bars increasing in strength and volume.
The momentum was eventually exhausted as the price failed to make higher highs; a doji followed by an inverted hammer perfectly illustrated the balance and indecision between bulls and bears.
RSI Analysis
As bullish conditions develop, the RSI rises above the median 50 reading, suggesting a change in sentiment, increased volatility, and growing interest in the stock’s increasing share price. As momentum and volatility strengthen, the reading eventually prints at over 70, typically the zone indicating buyers have overbought the asset.
We can also see a bearish divergence; while the candles make higher highs at the peak of the bullish movement, the RSI is beginning to generate lower readings. This phenomenon is often the precursor of a change to bearish conditions.
However, these observations aren’t necessarily the time to close and/or stop and reverse trading direction, as price can continue to rise when the movement’s momentum appears to fade according to the RSI.
At this point, traders have decisions to make: Do they close their trade because they’re delighted with the profit banked, or do they remain in the trade awaiting further confirmation to exit?
Bottom Line
Short-term traders like RSI because it provides clear signals, helps confirm trends, and can identify potential reversals.
It is a valuable tool for novice and experienced traders, and its versatility and ease of use have made it a staple in technical analysis.
As with many aspects of TA, the indicator is not infallible. As illustrated in the above example, it’s best to combine RSI use with a thorough analysis of candlestick patterns and other day trading indicators if required.
Article Sources
The writing and editorial team at DayTrading.com use credible sources to support their work. These include government agencies, white papers, research institutes, and engagement with industry professionals. Content is written free from bias and is fact-checked where appropriate. Learn more about why you can trust DayTrading.com