How to Calculate CFROI

Cash flow return on investment (CFROI) is a valuation method by which it is assumed that the stock market sets prices based on cash flow rather than company performance and earnings reports.
For the company, it essentially equates to an internal rate of return (IRR) calculation.
Calculating CFROI
The CFROI is compared to the total cost of capital of the firm – as determined by its relative proportion of debt and equity, with each respectively multiplied by the cost of debt and cost of equity and added together.
If the CFROI exceeds the cost of capital, it is deemed to be a worthwhile project based on the ability to finance the debt and investors’ expected return on their investment.
Given CFROI is simply internal rate of return, we use the same mathematical framework when calculating CFROI.
Measuring IRR can be done as an internal variable when looking at net present value (NPV) as a function of rate of return when the equation is set equal to zero.
The IRR follows the general mathematical framework:
NPV = ∑ C,t / (1 + r)^t = 0
Where:
- C,t = cash flow of a given period, t
- r = internal rate of return (IRR)
- t = time period, usually in years
NPV Example
Let’s say our initial investment into a project is $1,000.
And assume this project generates $100 in year one, and then an extra ten percent of the initial return in each subsequent year ($110 in year two, $121 in year three, etc.).
The IRR after five years would therefore be set up as follows:
NPV = -$1,000 + $100 / (1 + r) + $110 / (1 + r)^2 + $121 / (1 + r)^3 + $133.10 / (1 + r)^4 + $146.41 / (1 + r)^5 = 0
To make life easy, we can calculate the value of r using Excel’s IRR function.
We put in the cash flows (e.g., -1000, 100, 121, etc.) into our chart, and then use the IRR command specified to the particular range over which we want to assess IRR and find our answer that way.
The cash flow chart will appear as:
 For the above example, the IRR would be -14 percent after five years. After another year it would be -6.5 percent, or not quite up to breakeven.
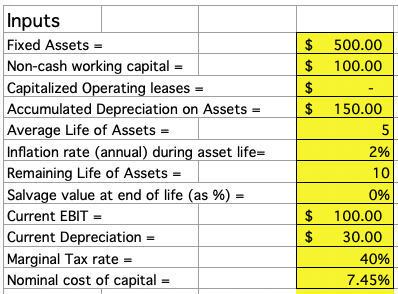
For our CFROI model, we need the following inputs:
- Fixed assets
- Non-cash working capital
- Capitalized operating leases
- Accumulated depreciation of assets
- Average life of assets
- Inflation rate during asset life (annual)
- Remaining life of assets
- Salvage value at end of life as %
- Current EBIT
- Current depreciation
- Marginal tax rate
- Nominal cost of capital
 Fixed assets are items that are purchased intended for long-term use, such as plant, property, and equipment.
Non-cash working capital is defined as current assets minus current liabilities while netting out any cash items.
Capitalized operating leases are rental agreements that allow an individual to use an asset for a particular period of time.
To obtain the total life of the assets, we add the average life of the assets to their remaining life.
For instance, if our assets average five years in age and we expect them to last for another ten years, then the remaining asset life (listed as an output) is fifteen.
The salvage value at the end of the asset’s life is the percentage of the original value of the asset can be claimed when ready to dispose of it. Many items will have no value at the end, or very little.
Then finally, we have the standard income statement items, such as earnings before income and taxes (EBIT) and depreciation.
The nominal cost of capital (i.e., not controlling for inflation) is manually input into the spreadsheet. At the end, the real cost of capital (i.e., controlling for inflation) is used to compare against the CFROI.
The real cost of capital serves as a hurdle rate to determine if the company is performing adequately in terms of paying off debt and satisfying investors’ expected return.
Outputs
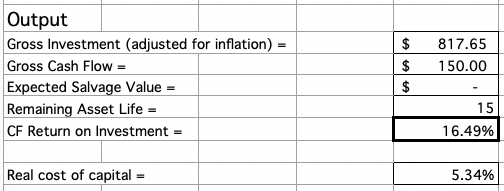
 Now we need to define our outputs that eventually feed into the determination of CFROI.
First, we need gross investment.
Since we are doing valuation over several years, we must adjust this figure for inflation.
The entire calculation will appear as:
Gross Investment = (Fixed assets + Accumulated depreciation on assets) * (1 + Inflation rate) ^ (Avg. life of assets) + Non-cash working capital + Capitalized operating leases
The negative value of this number will be the first cash flow entry when doing our internal rate of return calculation, as it represents an investment or cash outflow.
The gross cash flow from the investment is equal to:
Gross CF = Current EBIT * (1 – Tax rate) + Current depreciation
To find the cash flow in each subsequent year after the initial investment (the calculation that goes into finding CFROI), we will need to add gross cash flow onto the expected salvage value.
We can calculate this as follows:
Expected Salvage Value = Gross investment * Salvage value at end of life
For example, if our gross investment is $800 and the salvage value when we go to dispose of these assets is 10 percent (that is, we can obtain 10 percent of our original paying price), our expected salvage value would be $80.
The length of our investment project is equal to the sum of the average asset life and the number of years these assets are expected to last to give us remaining asset life.
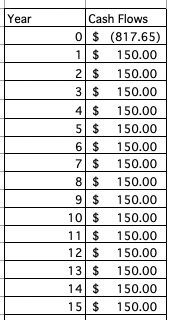
We would then create a table with the remaining asset life as our number of years, and cash flow respective to each year entered beside it.
To find our CFROI, we would then use Excel’s IRR command, from the cash flow in “year 0” all the way through cash flow in the final year of its viability.
When we have CFROI, we need to juxtapose it alongside the real cost of capital to determine if the project is actually worth investing in.
We obtain the real cost of capital via this equation:
Real Cost of Capital = (1 + Nominal cost of capital) / (1 + Annual inflation rate during asset life) – 1
If CFROI is greater than the real cost of capital, then this project is economically viable.
If not, then it would be best to pass and consider alternative investments.
CFROI for Valuation Purposes
With cash flows and cost of capital available, I added an addendum onto the bottom of the spreadsheet concerning the use of CFROI for company valuation purposes.
The only we have to add is an anticipated growth rate for the firm and some other intermediary variables calculated from what we already have.
This model is only effective for companies undergoing stable growth.
I added a terminal value calculation, which is equal to:
Final year of cash flow * (1 + Growth rate) / (Real cost of capital – Growth rate)
Also a cumulative cost of capital. Given our cost of capital is given for “year 0” (when we make our initial investment), and we don’t obtain our final year cash flow until the next period and the capital structure of this firm doesn’t change, we can multiply this figure as follows:
Cumulative cost of capital = (1 + Cost of capital)^2
Multiplying the cumulative cost of capital is always 1 + the cost of capital multiplied by 1 + the cost of capital of the next period, and so on.
But given our capital structure is assumed to not change, we can simply square what we have.
We also need a present value.
This is equal to:
PV = (Terminal value + Final year cash flow) / Cumulative cost of capital
To find the value of the firm, we sum the present value from above and the present value of our initial investment.
The present value of our initial investment is equal to:
PV of investment = Funds invested / (1 + Cumulative cost of capital)*
* And note that the cumulative cost of capital used is with respect to that period. Given this occurred at the beginning of our valuation period in this case, it would be one plus the cost of capital.
Conclusion
The CFROI helps to assess the viability of business investments according to a real (i.e., inflation-adjusted) cost of capital.
To ascertain whether the corporation is obtaining adequate returns, its CFROI must be compared alongside its real cost of capital.
The particular advantage of CFROI is that it ties financial performance to the ability of the corporation to generate cash flow.
The CFROI is essentially no different than an internal rate of return measurement, but with respect to its operating assets through an assessment of a continuous series of after-tax cash flows.
Some investment banks, such as Credit Suisse, will take these cash flows and discount them back to their present value to obtain an estimation of the value of a company.
Accordingly, CFROI can be used as a valuation model in and of itself.