Fat Tails in Trading (Kurtosis Trading)


Exploiting fat tails in trading is a statistical approach used in financial markets to identify and exploit anomalies in the distribution of asset returns.
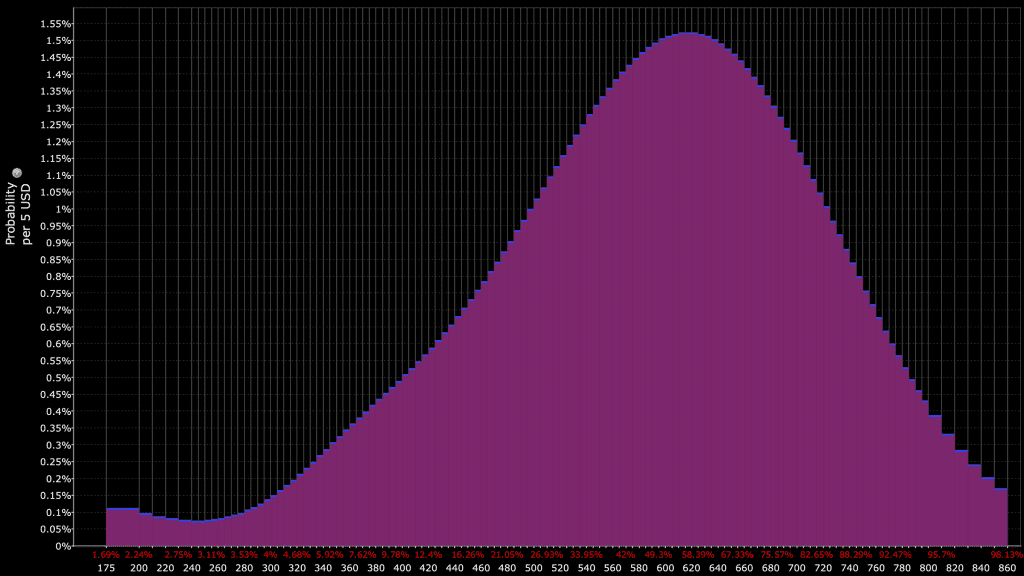
It focuses on the concept of kurtosis, a statistical measure that describes the shape of the distribution’s tails in relation to its overall shape.
Key Takeaways – Fat Tails in Trading
- Higher Probability of Extremes
- Fat tails indicate a greater likelihood of extreme market events, both positive and negative, compared to normal distributions.
- Risk Management
- Recognizing fat tails helps in adjusting risk models to better anticipate and reduce the impact of rare but severe market moves (or taking advantage of them when favorable).
- Strategic Opportunities
- Traders can exploit fat tails by using options and other derivatives to benefit from the increased probability of significant price shifts.
Understanding Kurtosis
Kurtosis is a measure of the “tailedness” of the probability distribution of a real-valued random variable.
It helps to identify whether the data points in a dataset are heavy-tailed or light-tailed relative to a normal distribution.
There are three types of kurtosis:
- Mesokurtic: Distributions with kurtosis similar to the normal distribution (kurtosis ≈ 3).
- Leptokurtic: Distributions with heavy tails and a sharp peak (kurtosis > 3).
- Platykurtic: Distributions with light tails and a flatter peak (kurtosis < 3).
Most financial distributions are fat-tailed relative to the normal distribution.
Importance of Kurtosis in Trading
In financial markets, the assumption of normally distributed returns often fails.
Asset returns frequently exhibit leptokurtic behavior.
This means that extreme outcomes (both positive and negative) are more likely than predicted by a normal distribution.
Recognizing this can provide traders with a strategic edge.
Risk Awareness
At the least it can make them more aware of the risks.
In modern finance, understanding of fat-tailed returns distributions has caused portfolio construction to be more diversified and engineered to improve the positive skew of the portfolio and lower left-tail risk.
Kurtosis and Risk Management
Kurtosis is important for risk management.
Leptokurtic distributions indicate higher probabilities of extreme events, suggesting that standard risk measures like Value at Risk (VaR) may underestimate the true risk.
By incorporating kurtosis into risk models, traders can better anticipate and reduce the impact of outliers.
Strategies in Kurtosis Trading
Tail Risk Hedging
Tail risk hedging involves protecting portfolios against extreme market movements.
Strategies may include:
- Buying out-of-the-money options – These provide payouts during extreme market moves. They benefit from the increased likelihood of tail events in leptokurtic distributions.
- Dynamic hedging – Adjusting hedge positions based on changes in market volatility and kurtosis.
Volatility Trading
Volatility trading strategies exploit the differences in implied volatility and realized volatility, often using kurtosis as a way to enhance predictions:
- Straddle or strangle options strategies – These involve buying or selling options to benefit from high volatility, which is more probable in leptokurtic distributions.
- Volatility arbitrage – Use statistical models to predict future volatility and identify mispriced options. Most options traders focus on volatility (variance) and don’t study higher moments, such as the skew and kurtosis of the distribution of expected outcomes.
Measuring and Monitoring Kurtosis
Statistical Tools
Traders use statistical tools to measure and monitor kurtosis in asset returns:
- Kurtosis coefficient – Calculated using historical return data to assess the tailedness of the distribution.
- Jarque-Bera test – A statistical test that checks for departures from normality, including skewness and kurtosis.
Software and Platforms
Various trading platforms and software tools offer features to analyze kurtosis:
- Python, MATLAB, and R – These programming languages provide extensive libraries for statistical analysis, including kurtosis.
- TradingView and Bloomberg – These platforms offer real-time data and analytics to monitor kurtosis in financial markets.
Practical Considerations
Data Quality
Accurate measurement of kurtosis requires high-quality data.
Incomplete or erroneous data can lead to misleading conclusions and poor trading decisions.
Market Environment
Kurtosis can vary significantly across different market conditions.
Traders need to adapt their strategies to changing market dynamics, continuously monitoring kurtosis and adjusting their risk management approaches.
Let’s look at some trades involving kurtosis:
Example 1: GameStop and AMC in 2021
The trading events surrounding GameStop (GME) and AMC in early 2021 are prime examples of fat tails in trading.
These stocks experienced extreme price movements far beyond what traditional models predicted.
This highlighted the risks associated with shorting stocks – especially those with small market caps and high short interest that can lead to a squeeze – and the importance of considering factors beyond fundamentals.
Repricing of the Right Tail
- Extreme Volatility – Both GME and AMC saw unprecedented price surges due to massive retail investor buying spurred by social media platforms like Reddit.
- Short Squeeze – Traders shorting these stocks faced huge losses as prices soared, demonstrating the underestimated risk of such positions.
- Repricing – The right tail of the price distribution significantly repriced itself, showing that extreme positive returns were much more likely than previously thought.
Underestimated Catalysts
- Flows and Sentiment – The impact of retail investor sentiment and coordinated buying was undervalued. Massive trading volumes and positive sentiment drove prices to new highs.
- Positioning – The concentrated short positions held by institutional investors were a critical but overlooked factor. The subsequent short squeeze amplified price movements.
- Overvalued Fundamentals – Traditional valuation metrics failed to account for the impact of these dynamic market forces, leading to a misjudgment of risk.
These events underscored the importance of considering market sentiment, trading flows, and positioning in risk assessments, as fundamental analysis alone was insufficient to predict such extreme market behavior.
Example 2: Tail Risk Hedging with Out-of-the-Money Options
Assume you manage a portfolio of $1,000,000 in a stock index fund.
You are concerned about potential market downturns and want to hedge against extreme negative returns.
Here are the steps:
Determine the Option to Buy
Identify an out-of-the-money put option on the stock index fund.
Suppose the stock index fund is currently trading at $100.
Choose a put option with a strike price of $90, expiring in six months.
Calculate the Amount
Each put option contract typically represents 100 shares.
Determine the number of contracts needed to hedge the portfolio.
For simplicity, assume each contract costs $2.
Execute the Trade
Calculate the number of contracts: 1,000,000 / (100 × 90) = 111.11. Round to 111 contracts.
- Total cost = 111 × 2 × 100 = $22,200
Monitor the Position
Regularly assess the market and the portfolio.
Adjust the hedge if there are significant changes in the market or the portfolio value.
Example 3: Volatility Trading with Straddle Options Strategy
You anticipate a significant market move but are uncertain of the direction. The current price of a stock is $50.
Determine the Options to Buy
Identify at-the-money call and put options on the stock.
Suppose both options have a strike price of $50, expiring in one month.
Calculate the Amount
Each option contract typically represents 100 shares.
Assume the call option costs $3 and the put option costs $2.50.
Execute the Trade
Decide the number of contracts: Suppose you choose to trade 10 contracts of each option.
- Total cost = (10 × 3 × 100) + (10 × 2.5 × 100) = $5,500
Monitor the Position
Track the stock price movement and volatility.
Close the position if a significant move occurs or adjust based on changes.
Example 4: Volatility Arbitrage with Statistical Models
You have identified a stock where historical data suggests the realized volatility is consistently higher than the implied volatility.
Data Analysis
Use statistical software to analyze historical volatility data.
Suppose the stock’s current price is $80.
Assume implied volatility suggests a 10% annualized movement, while historical data shows a 15% movement.
Determine the Options to Trade
Find at-the-money options with different expirations.
Choose a call option with a strike price of $80, expiring in three months.
Calculate the Amount
Each option contract typically represents 100 shares.
Assume the option costs $4.
Execute the Trade
Decide the number of contracts: Suppose you choose to trade 20 contracts.
- Total cost = 20 × 4 × 100 = $8,000.
Monitor the Position
Track changes in implied and realized volatility.
Adjust the position or close it based on updated volatility data and market movements.
Considerations
- Risk Management – Always consider the risk of the positions and have a clear exit strategy.
- Transaction Costs – Account for transaction costs, which can affect the profitability of the trades.
- Market Conditions – Stay informed about the current state of markets and how the tails are priced, as they can materially impact the outcomes of these trades. An option might be priced correctly even for an asset with large fat tails.
By implementing these strategies, traders can use kurtosis trading to hedge risks and potentially profit from market volatility.