Exponential Moving Average (EMA)


The Exponential Moving Average (EMA) is a type of moving average used in the analysis of financial markets to smooth price data over a specified period.
Unlike the Simple Moving Average (SMA), which gives equal weight to all observations in the period, the EMA places greater weight on more recent prices. This makes it more responsive to new information and more appealing to short-term traders looking to capitalize on quick market shifts.
The EMA remains one of the go-to tools for trend analysis. This beginner’s guide will teach you how to use it.
Quick Introduction
- The EMA gives more weight to recent price data, helping to reduce the lag seen with other moving averages and making it more responsive to the latest market moves.
- Thanks to this quicker response, the EMA can pick up on trends or potential reversals faster than a simple moving average (SMA). It’s a great tool for spotting those shifts earlier.
- Short-term traders love using the EMA to gauge the trend’s direction. When it’s going up, it typically signals an uptrend, while a downward EMA points to a possible downtrend.
Best Brokers For EMA Analysis Trading
These 4 trading platforms offer the EMA indicator and are our top recommendations for day traders:
-
1
 OANDA USCFDs are not available to residents in the United States.
 -
2
 FOREX.com
 -
3
 xChief
 -
4
 InstaTrade
How It Works
In simple terms, the EMA updates itself by factoring in new price data more heavily than older data, allowing traders to stay in tune with current trends while ignoring older, less relevant data.
- Weighting Recent Prices More: The EMA applies more weight to recent price data. So, if you’re using a 10-day EMA, the most recent days will have a bigger impact on the average than earlier days. This weighting reduces the lag seen in other averages and makes the EMA faster at reflecting the current trend.
- Smoothing the Data: While it reacts more quickly to new information, the EMA still smooths out random price fluctuations, helping traders focus on the overall trend instead of daily noise.
- Rolling Calculation: The EMA uses a continuous calculation. Once you have the initial average, each new EMA value is based on the previous day’s EMA plus the new day’s price. This rolling calculation keeps the line updated and fluid.
- Smoothing Factor: The formula uses a smoothing constant (k) to determine how much weight to give to recent prices. This factor depends on the period you’re calculating (like 12-day, 26-day, etc.). A shorter period makes the EMA more sensitive to price changes, while a longer period smooths out the data even more.
The Exponential Moving Average (EMA) is a crucial tool in a technical analyst’s toolkit. It helps me smooth out price data, identify trends, and generate buy or sell signals based on crossovers and price interaction with the EMA line.While no indicator is perfect, the EMA’s ability to prioritize recent price data makes it particularly valuable in volatile or trending markets.
Formula For The EMA
The formula for the EMA is more complex than the SMA. The EMA for a given day is calculated as follows:
EMA today = (Price today – Price yesterday) / k + EMA yesterday
Where:
- Price today is the closing price today.
- EMA yesterday is the EMA value for the previous day.
- k is the smoothing constant, calculated as k = 2 / n+1, where n is the number of periods used for the EMA (e.g., 12-day, 26-day).
How To Use The EMA
- Identifying Trends: Traders look at the slope of the EMA line to figure out the market’s direction. If the EMA line is steep, it usually signals a stronger trend, whether it’s up or down.
- Support and Resistance: The EMA often acts as a kind of dynamic support or resistance level. For example, in an uptrend, prices might dip back toward the EMA before bouncing and continuing upward.
- Crossovers: One popular strategy involves using two EMAs with different time periods.
- A bullish crossover happens when a shorter EMA (like the 12-day) crosses above a longer EMA (such as the 26-day), suggesting a potential buying opportunity.
- A bearish crossover occurs when the shorter EMA crosses below the longer EMA, indicating a potential sell signal.
Common EMA Timeframes
- 12-day and 26-day EMAs: These are often used in calculating the MACD (Moving Average Convergence Divergence), which is another popular tool for technical analysis.
- 50-day and 200-day EMAs: Traders use these to track long-term trends. If the 50-day EMA crosses above the 200-day EMA, it’s called a “Golden Cross” and is considered a bullish signal. When the reverse happens, it’s called a “Death Cross,” which signals a bearish trend.
EMA Vs SMA
- Responsiveness: The EMA reacts faster to price changes than the SMA, making it more appealing for short-term traders looking to catch quick shifts in market trends. The SMA, on the other hand, smooths out price changes more evenly, which can make it less sensitive to sudden moves.
- Lag: Since the EMA adjusts more quickly to new data, it has less lag compared to the SMA. This means it can help spot turning points in the market earlier. However, the downside is that it can sometimes generate false signals in choppy or sideways markets.
Why Traders Like The Exponential Moving Average
Traders often prefer the Exponential Moving Average (EMA) for a variety of reasons, mainly because of its responsiveness and ability to adapt to market changes.
Here are 10 key reasons why traders like the EMA:
1. Faster Reaction to Price Changes: The EMA reacts more quickly to recent price moves, making it ideal for traders who want to catch trends early or respond to sudden market shifts.
2. Less Lag: Compared to the Simple Moving Average (SMA), the EMA has less lag, meaning it reflects the most recent market conditions more accurately. This allows traders to make quicker decisions.
3. Smooths Out Noise: While the EMA responds quickly, it still smooths out the short-term volatility or “noise” in price movements, helping traders focus on the overall trend.
4. Effective for Trend Identification: The slope of the EMA line makes it easier to identify market trends. A rising EMA indicates an uptrend, while a falling EMA signals a downtrend.
5. Useful for Crossovers: Traders use the EMA in pairs to create crossover strategies. For example, when a short-term EMA crosses above a long-term EMA, it can indicate a buying opportunity and vice versa for selling.
6. Works Well with Other Indicators: The EMA pairs well with other technical indicators like the MACD (based on EMAs), RSI (Relative Strength Index), and Bollinger Bands, enhancing its utility in technical analysis.
7. Dynamic Support and Resistance: The EMA often acts as a dynamic support or resistance line. In trending markets, prices tend to bounce off the EMA line, helping traders identify good entry or exit points.
8. Customizable Timeframes: The flexibility to choose different periods (like 12-day, 26-day, and 50-day) makes the EMA adaptable to various trading styles, whether short-term day trading or long-term investing.
9. Widely Recognized: The EMA is one of the most commonly used indicators in technical analysis, meaning that many traders rely on it. This can lead to self-fulfilling patterns, as many people watch and act on the same signals.
10. Versatile Across Markets: The EMA is useful in multiple financial markets – stocks, forex, commodities, and cryptocurrencies – giving traders a consistent tool across different asset classes.
Applying The Exponential Moving Average
In this example of using the EMA to analyze charts and make trading decisions, I’m going to focus on the daily timeframe (D1) and use familiar and popular settings for an EMA crossover strategy: the 9 and 21.
With a 9 and 21-day EMA crossover strategy, the approach produces a buy signal every time the 9-day EMA crosses above the 21-day EMA and a sell signal when the 9-day EMA crosses below the 21-day EMA.
I’ve plotted the EMAs on a chart for the NASDAQ 100, a popular index I’ll trade using a CFD.
I rarely trade indices on a day-trading basis; typically, I’ll take my time to look for swing trading opportunities and be prepared to hold over the trade for several days if conditions allow and my technical analysis confirms my decision-making.
I always look for swing trading opportunities above day trading on indices because, in my experience, once a trend develops on an index, it’s more likely to gather momentum, and fewer whipsaws and volatility exist in such highly liquid and heavily capitalized markets.
There’s also one brilliantly effective and overlooked quality that comes with EMA trading strategies: it tells you when to get in and when to get out, meaning you should be able to cut your losses on a losing trade quickly if you’re highly disciplined.
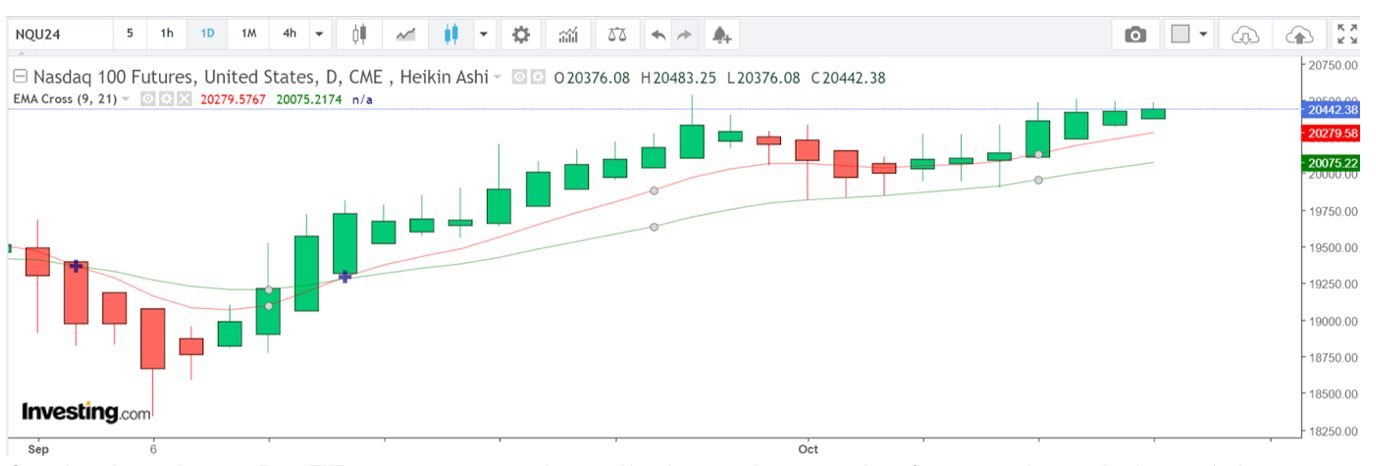
So, in the above D1 timeframe, we can see four distinct phases. Let’s start from left to right:
- A downward bearish phase appeared in the first phase, and the crossover encouraged me to enter short. The bearish phase abruptly ended, but rather than close immediately and reverse my trade direction to long and bullish, I waited until I received an alert on my platform and got the signal to reverse.
- I went long after experiencing a nominal loss on the bearish trade, roughly the spread cost and commissions. But crucially, because I followed my trading plan to the letter, I cut the loss immediately after I got the signal.
- The third phase is the consolidation phase in the NAS100 range market. We see a downtrend, as illustrated by the bearish HA candlestick formation, followed by a series of inverted hammers and dojis, indicating market indecision.
- The final and current phase sees a return to bullish momentum, which, based on my interpretation of the HA patterns and the EMA readings, will continue.
When will I exit? Only when I receive an alert on my platform indicating that a signal has been generated because of a bearish crossover.
That might result in me giving some profit back to the market, but unless you have the discipline to stick to a trading plan, you’re just guessing. If you’ve taken the time to create an effective trading strategy with positive expectancy underpinned by tight money management, then stick with it.
Bottom Line
Using EMAs to trade can be highly effective for identifying trends, generating buy or sell signals, and spotting potential turning points in the market. Their responsiveness to recent price changes makes them ideal for short-term traders.
When combined with other technical analysis tools, EMAs offer a well-rounded strategy for navigating various market conditions, helping active traders make informed decisions with greater confidence.