S&P 500 ‘Buy’ At 100% Fibonacci Retracement Level
- This topic has 2 replies, 1 voice, and was last updated 3 days ago by
 .
.
-
Topic
-
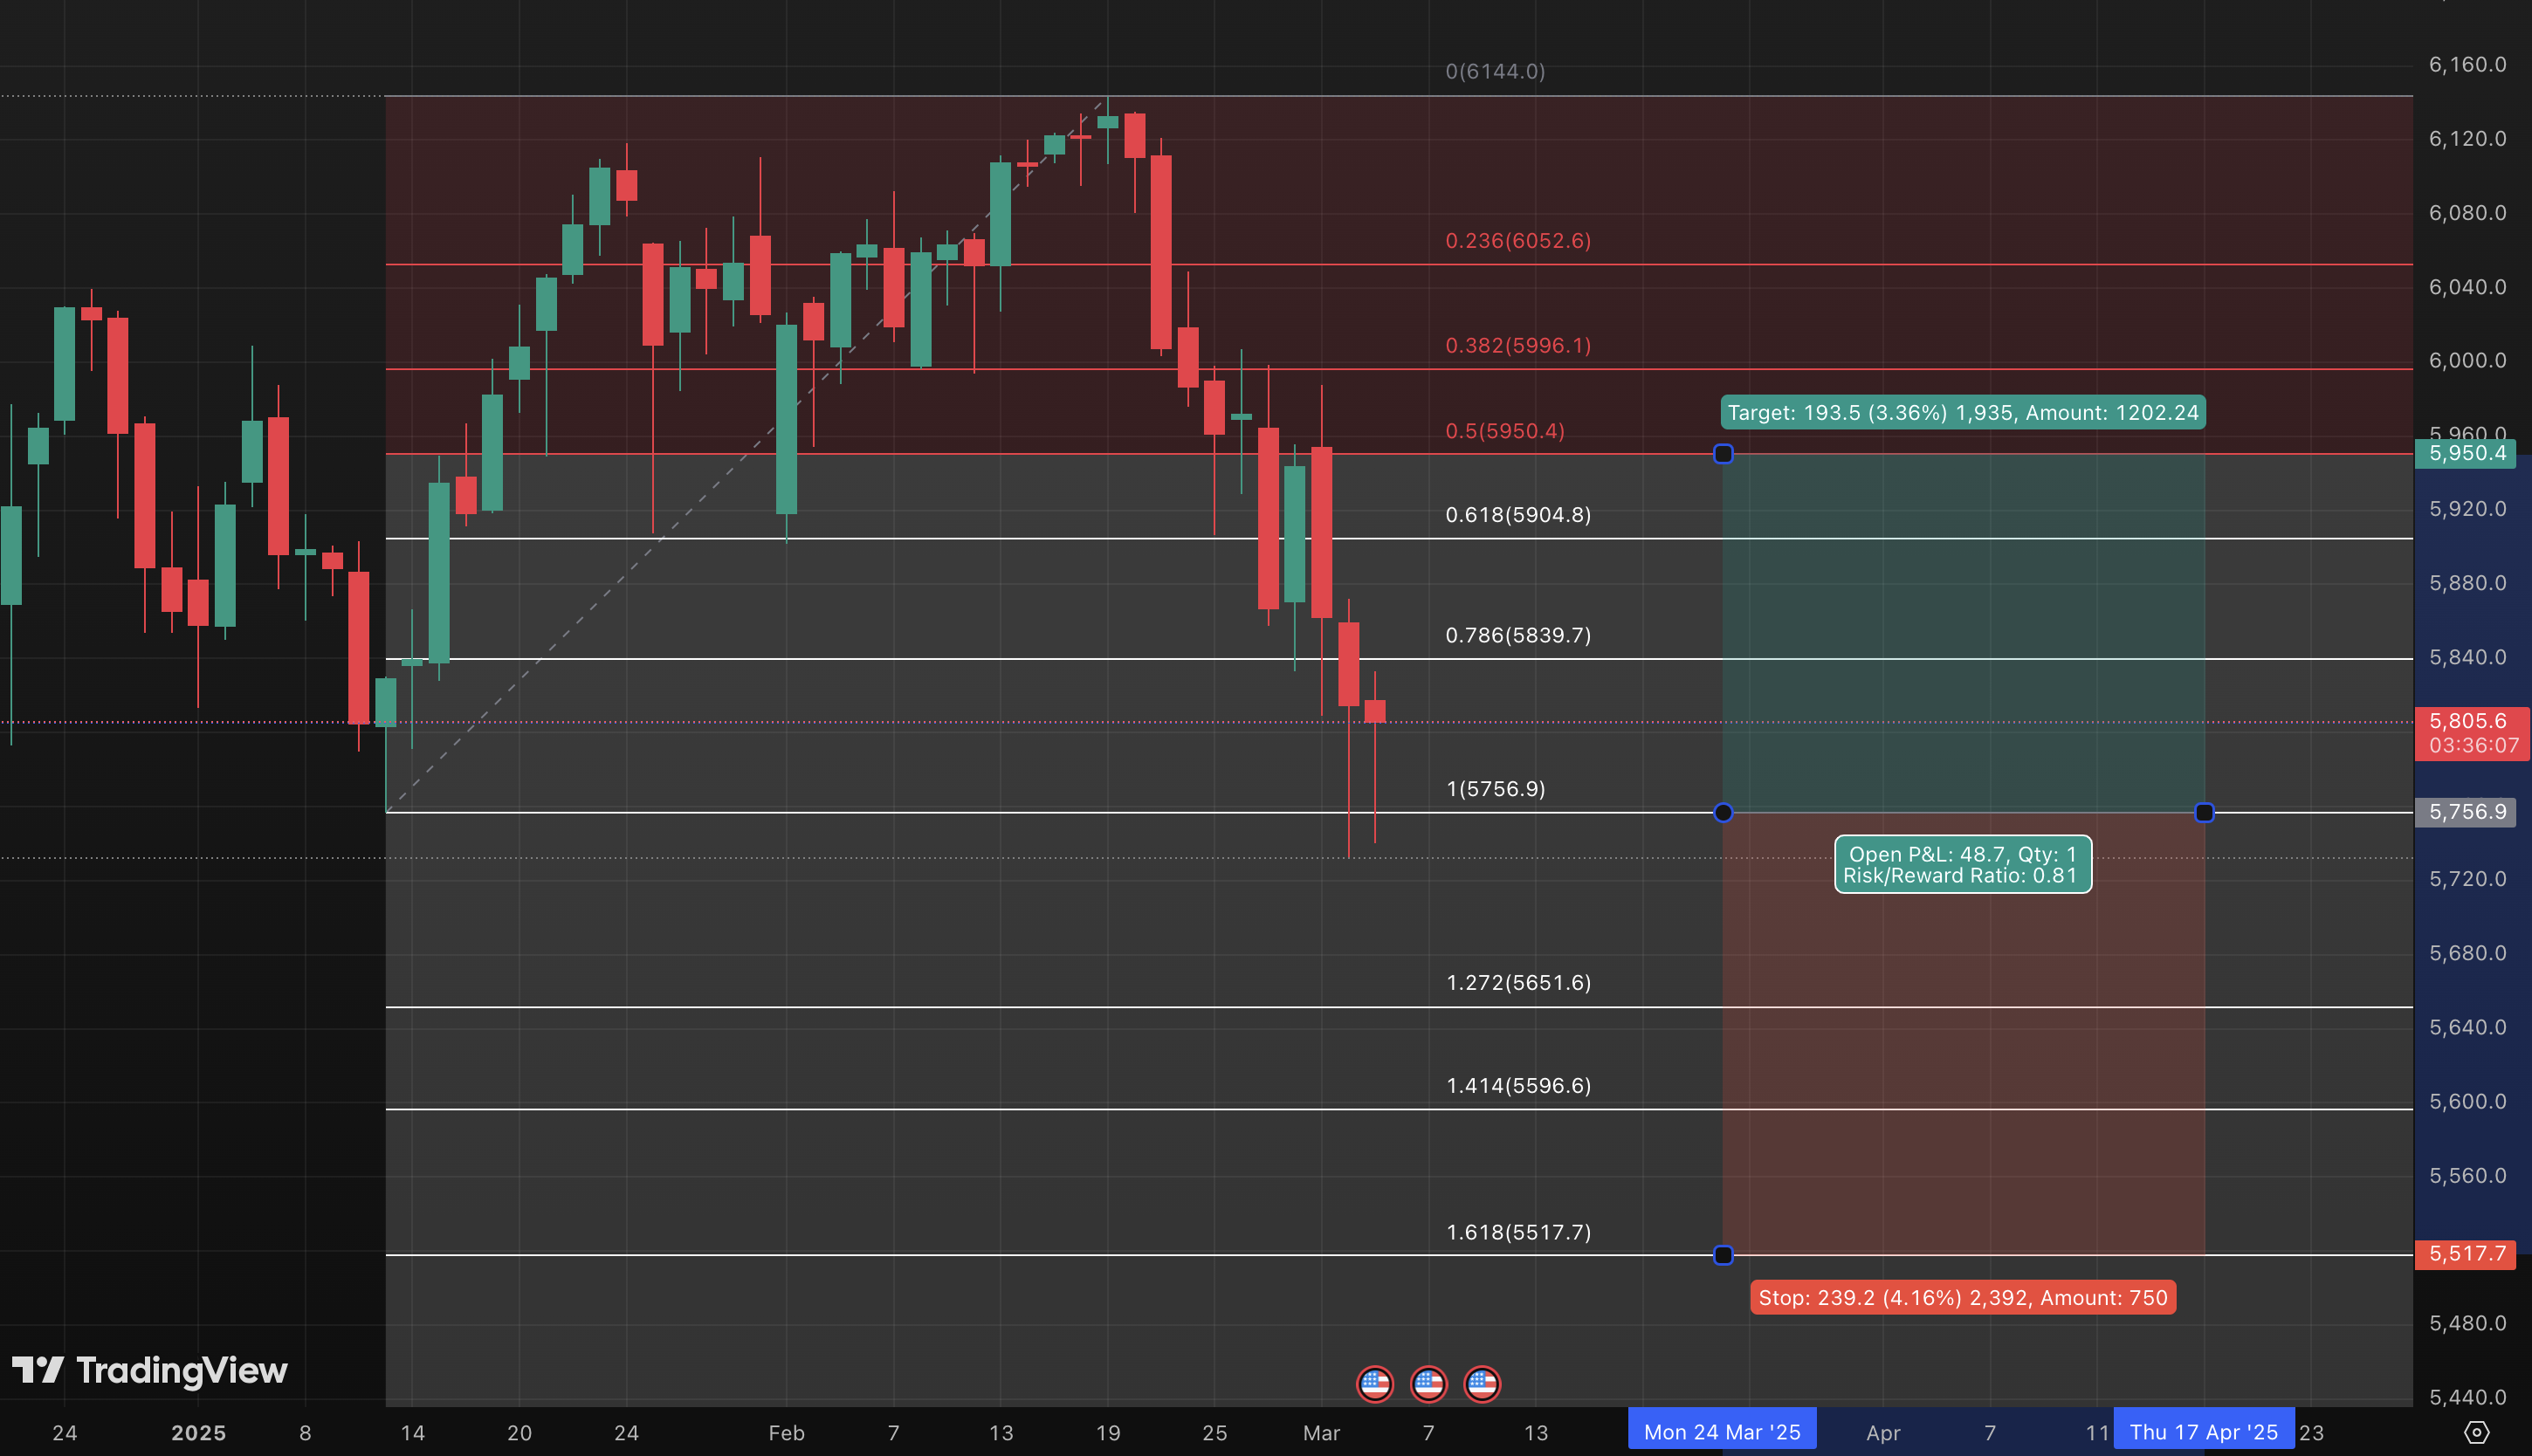
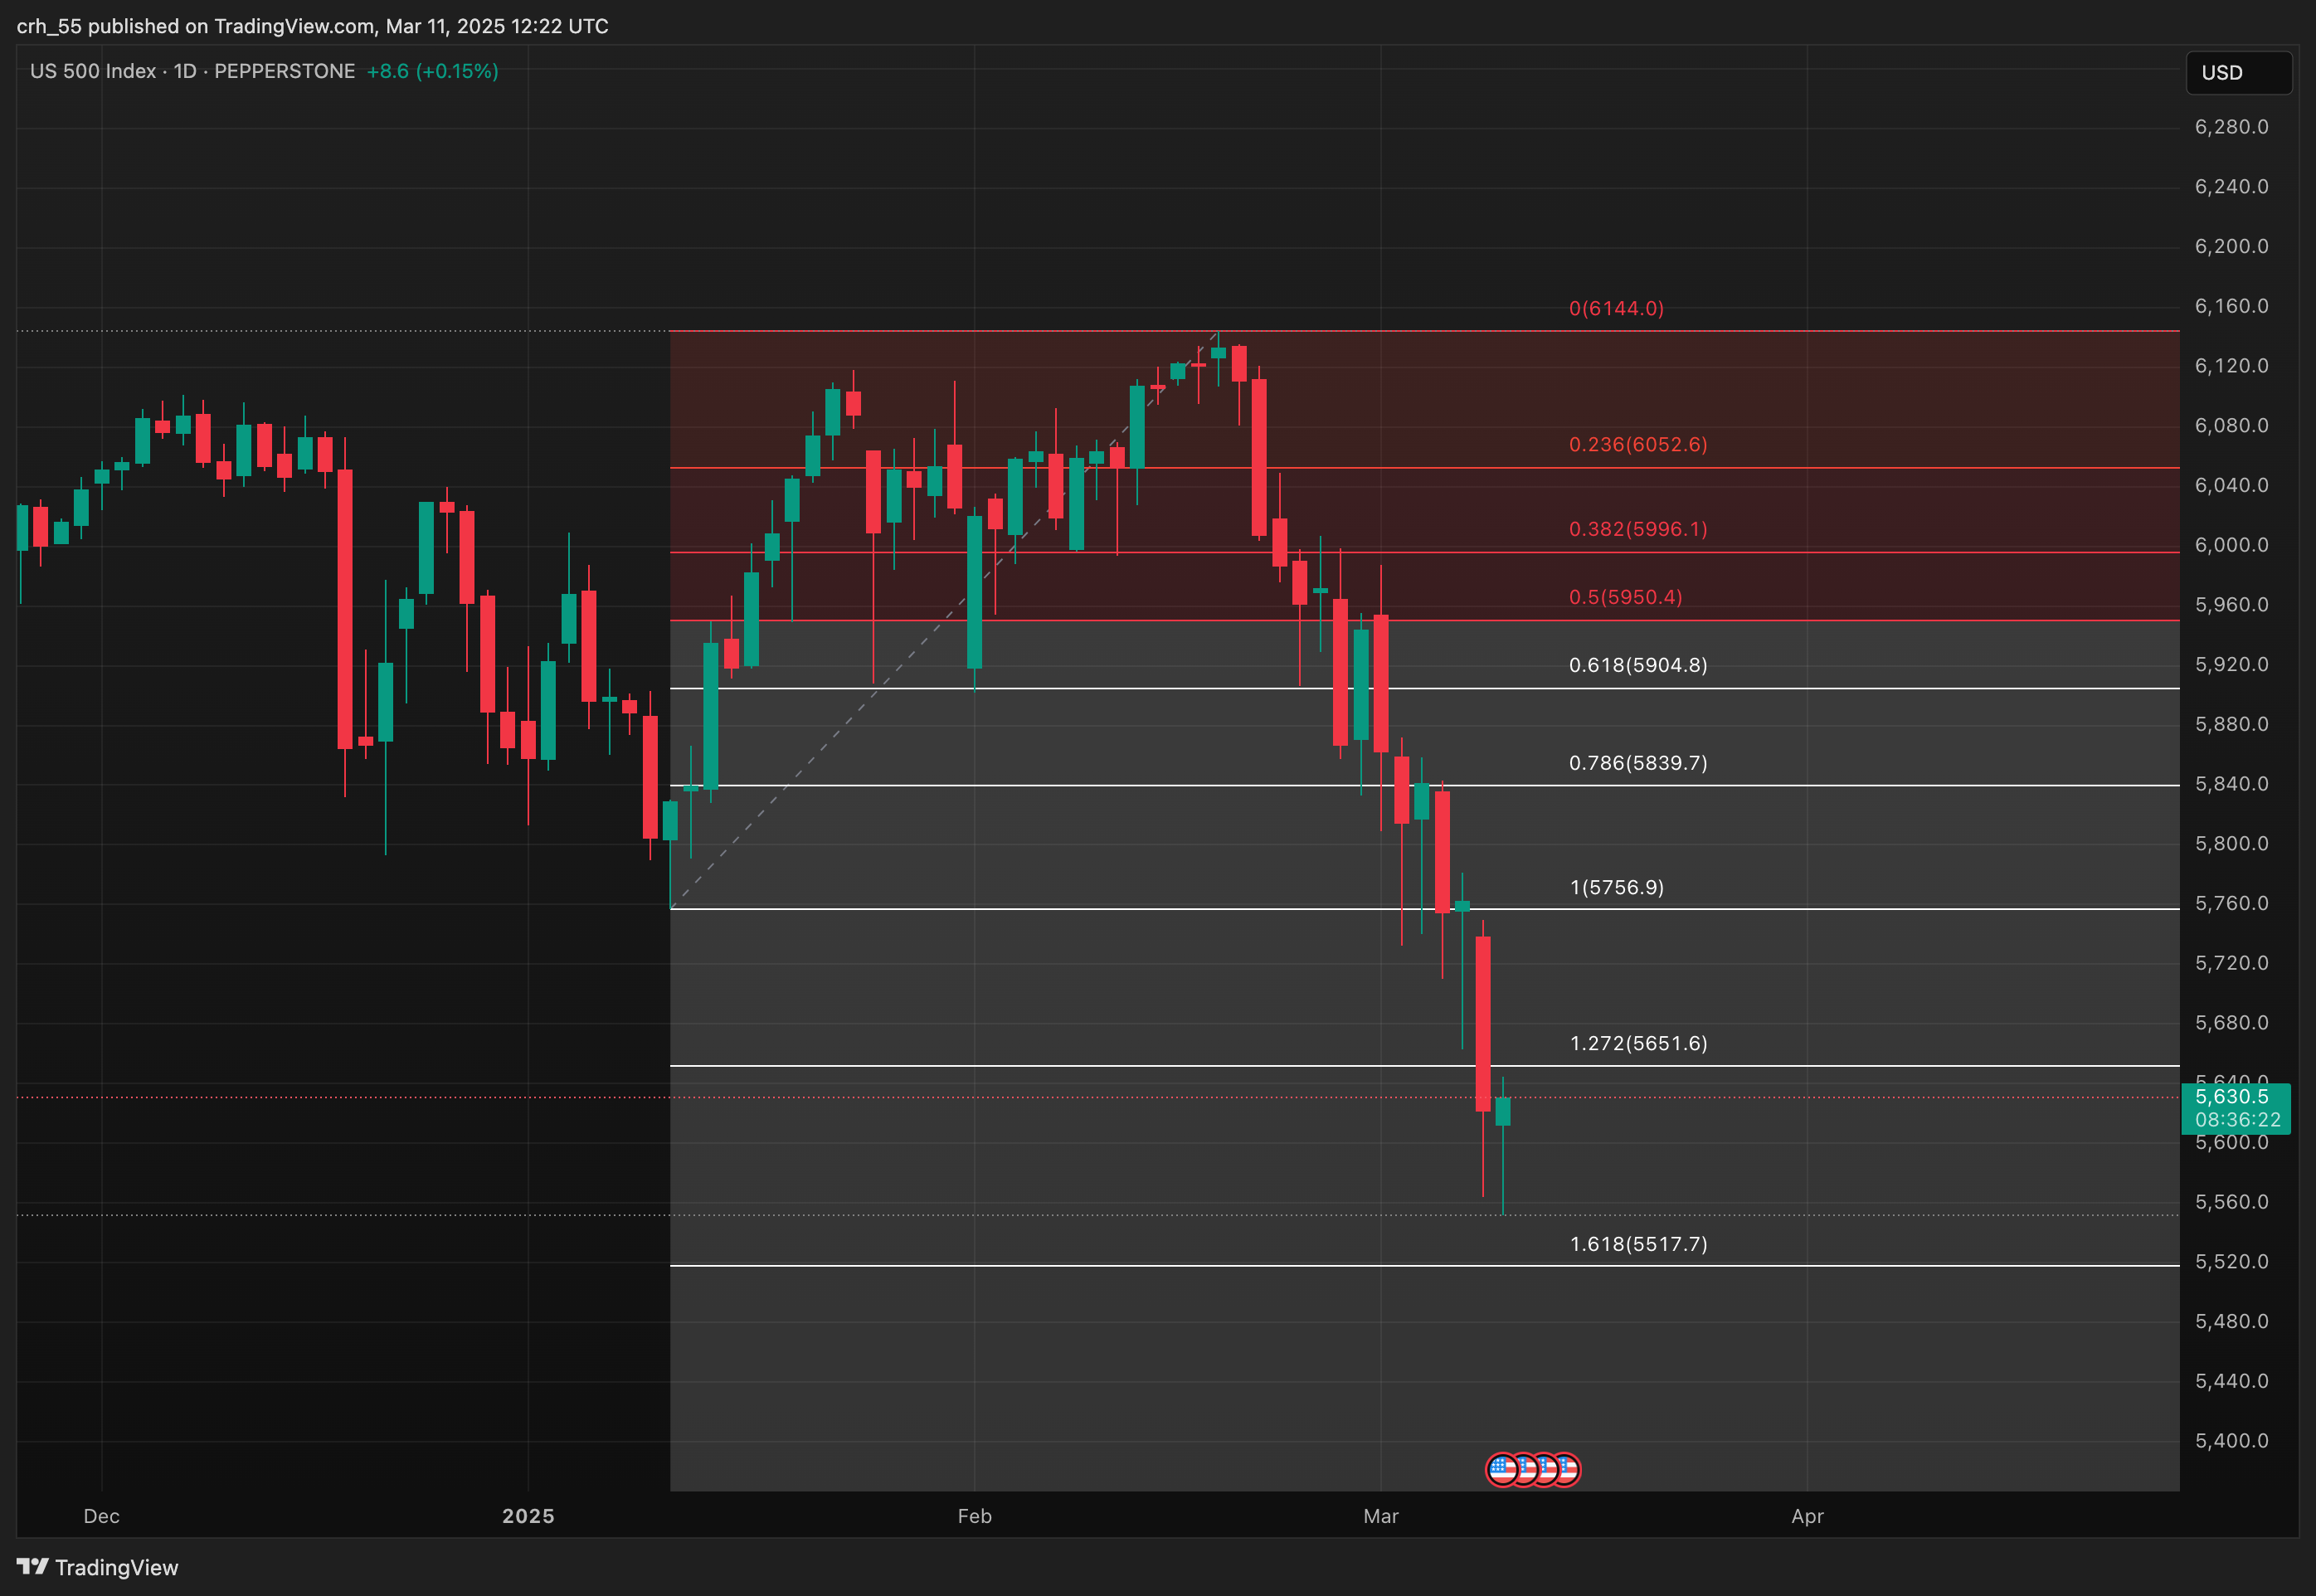
Here’s a potential S&P 500 trade setup to demonstrate using one of my favourite technical analysis tools, Fibonacci retracement.
Trade Setup
- 1-day timeframe for a swing trade
- Price hit 1 (100%) Fibonacci retracement level
- I’m bullish on the S&P 500, so I entered a long (buy) position
- I set my take profit at 0.5 Fibonacci level
- I set my stop loss at 1.618 Fibonacci level
- I am risking 4.16% to make 3.36%
Advanced Risk Management
- I could adjust my stop-loss as the trade moves in my favour.
Alternative Trade Setup
- I could enter multiple long positions to target multiple Fibonacci levels, but this would increase my risk. As a conservative trader, I prefer to enter only one position per price level in case my analysis is wrong.
Disclaimer: This example is for informational and educational purposes only and should not be considered financial advice or a recommendation to buy or sell any security. Trading involves significant risk, and past performance does not guarantee future results. Conduct your own research and consult with a financial professional. The information discussed here is personal to the author and may not be suitable for all traders.
Viewing 0 reply threads
Viewing 0 reply threads