How to read candlestick chart for day trading

  • This topic is empty.
  • Creator
    Topic
  • #198609 Reply
    Jack VT

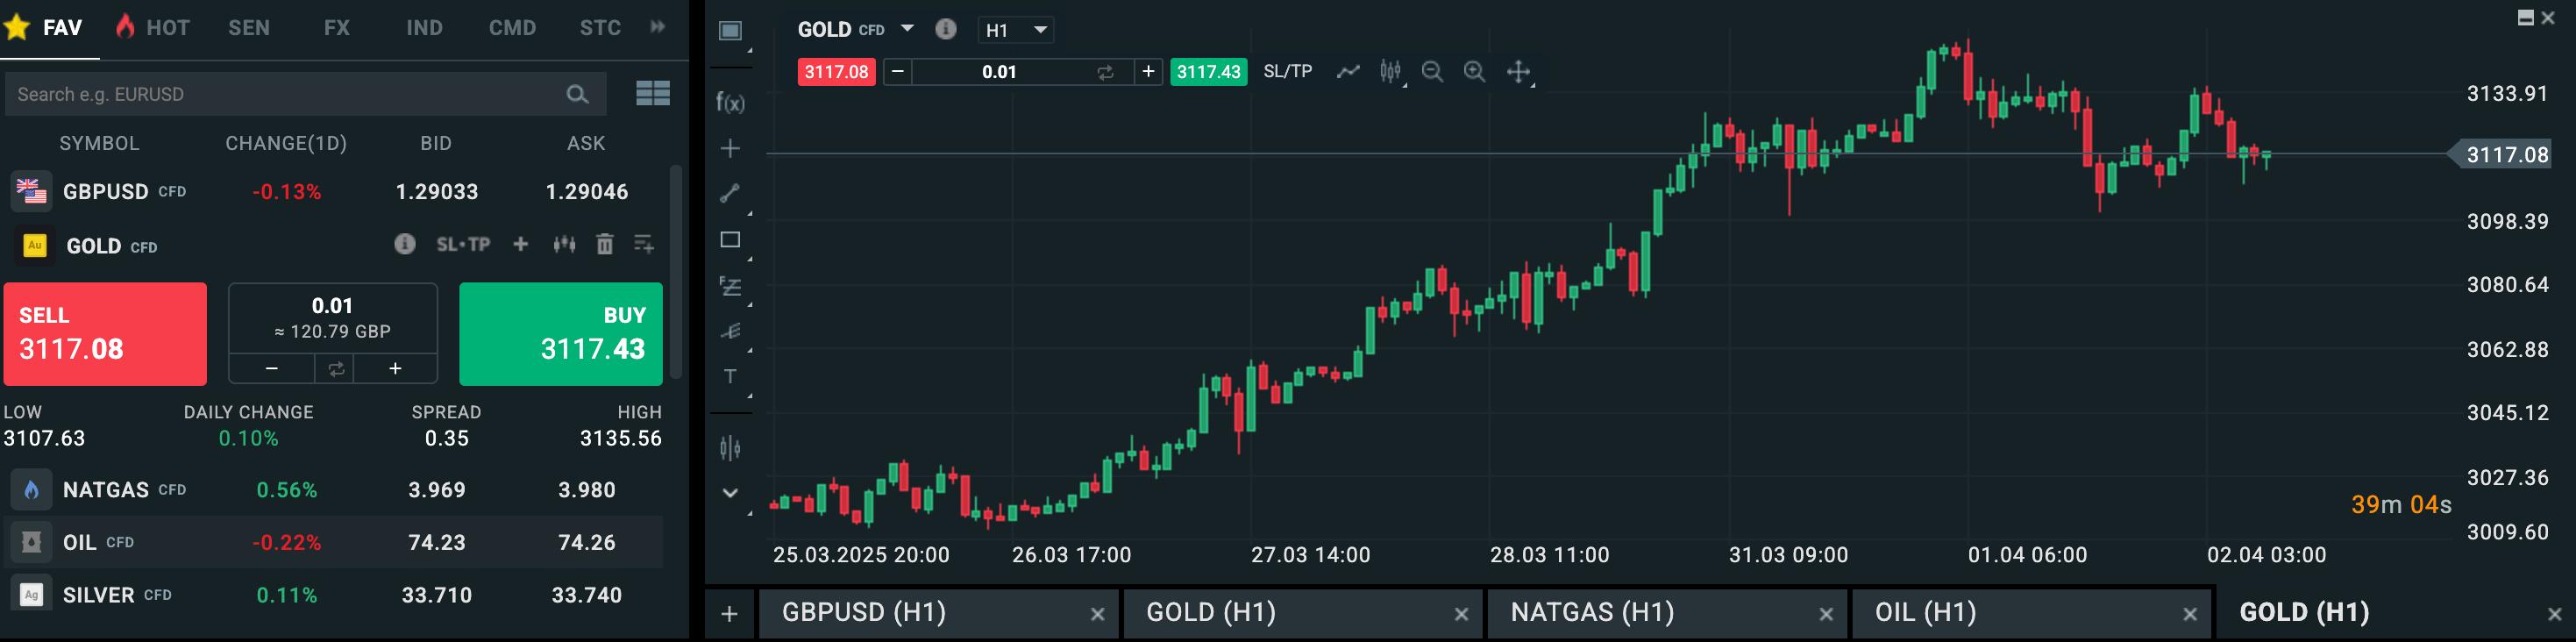
      Can someone talk me through, as if I’m a dummy, how I read a candlestick chart for day trading?

      Like in this gold chart I’m looking at in my trading platform I’ve recently opened, what do all the candles mean and indicate? What is it telling me?

      XTB candlestick gold chart


      Reply
    Viewing 4 reply threads
    • Author
      Replies
      • #198960 Reply
        Steve

          A candlestick chart shows price movements of an asset (like gold in your case) over a specific time period. Each candlestick represents a set time frame (like one hour in yours).

          It’s telling you a story about buyers and sellers fighting over the price of gold. Those big green candles indicate strong buying momentum (price is surging). Those big red candles are saying the opposite (more selling, price is falling fast).

          The small candles with long wicks point to indecision (buyers and sellers are battling but no clear winner).

          A long upper wick shows you that the price went up but got rejected (sellers pushed it back down, possible resistance).

          Equally a long lower wick tells you price went down but bounced back up (buyers stepped in, possible support).

          Reply
        • #198961 Reply
          Simon

            Each candle is formed of four key price points:

            • Open – The price at the start of the time period.
            • Close – The price at the end of the time period.
            • High – The highest price reached during that period.
            • Low – The lowest price reached during that period.

            Visually you’re looking at:

            • The body (rectangle) – Represents the range between the open and close prices.
            • Wicks (shadows) – Thin lines above and below the body showing the high and low prices.
            Reply
          • #198981 Reply
            Oliver D

              Learning to read a candlestick chart is an important step in any day trading journey.

              • Your chart shows a strong bullish trend from March 25 to April 1, with a series of higher highs and higher lows.
              • Most candlesticks in this period are green, pointing to buying pressure.
              • The price peaked around April 1, reaching approximately 3133 before starting to decline.
              • Around April 1 – April 2, the price started pulling back from the peak.
              • Several red candles indicate that sellers have gained control.
              • The last few candles suggest consolidation, meaning the market is deciding its next move.
              • A potential reversal pattern could be forming if the price breaks below 3107.63 support.
              • If the price finds support here and forms a strong bullish candle, the uptrend may continue.
              • If a strong bearish candle breaks below 3100, it may signal a trend reversal or a deeper pullback.

              The next question is how do you use the information gained from the chart?

              • Buyers might look for confirmation of support around 3107 – 3110 before entering long positions.
              • If the price breaks below 3107, sellers might consider shorting towards the next support levels.
              • Breakout traders might wait for a strong candle breaking above 3133 or below 3100 for a clearer trend direction.


              Reply
              • #199030 Reply
                Jack VT

                  Can’t thank you enough. This is exactly the take and understanding I was looking for. I’m logging in daily to read the charts and get better at following market trends.


                  Reply
              • #199031 Reply
                DaveyTrader

                  I would use a 1H chart to spot a setup or trend but if I’d drop down to the 5M or 15M for entry/exit timing. That way you get 1H for the big picture view and 5M or 15M for more precise execution.

                  Reply
                  • #199074 Reply
                    Jack VT

                      Nice tip, thanks. I’ll try that.

                      Reply
                  • #199258 Reply
                    Joey

                      What trading software are you using here @Jack VT

                      Reply
                      • #199328 Reply
                        Jack VT

                          It’s XTB’s xStation software.

                          Reply
                    Viewing 4 reply threads

                    Reply To: Reply #198981 in How to read candlestick chart for day trading
                    Your information:


                    Cancel