Binary Options Ichimoku Strategy


The binary options Ichimoku Cloud indicator can be used to provide market alerts and tactics, especially when combined with other trading tools, such as the RSI. In this binary options Ichimoku strategy guide, we will cover how the indicator helps with the development of price analysis, examples of traders using Ichimoku to open positions and the pros and cons of the technique. Find out how to trade binary options with a Ichimoku strategy.
Binary Options Brokers
The Ichimoku Strategy Explained
Developed in Japan during the 1930s by journalist Goichi Hosoda, the Ichimoku Cloud is based on temporal averages rather than opening and closing prices. This allows the indicator to generate signals with less volatility than a standard moving average indicator.
While most binary options indicators focus on one or two parts of an asset’s price movements, the Ichimoku uses a collection of graphing tools to provide a more detailed view. In addition to providing investors with alerts as to trend direction, the binary options Ichimoku strategy offers support and resistance levels and momentum signals.
Theoretically, this extra detail helps binary traders develop a strategy with a higher success rate than a more superficial indicator.
Breaking Down The Binary Options Ichimoku Indicator
The Ichimoku indicator is a complex graphing tool with plenty of elements. So to help binary options traders understand what at first glance appears to be a jumble of lines and boxes, we’ve broken down each component.
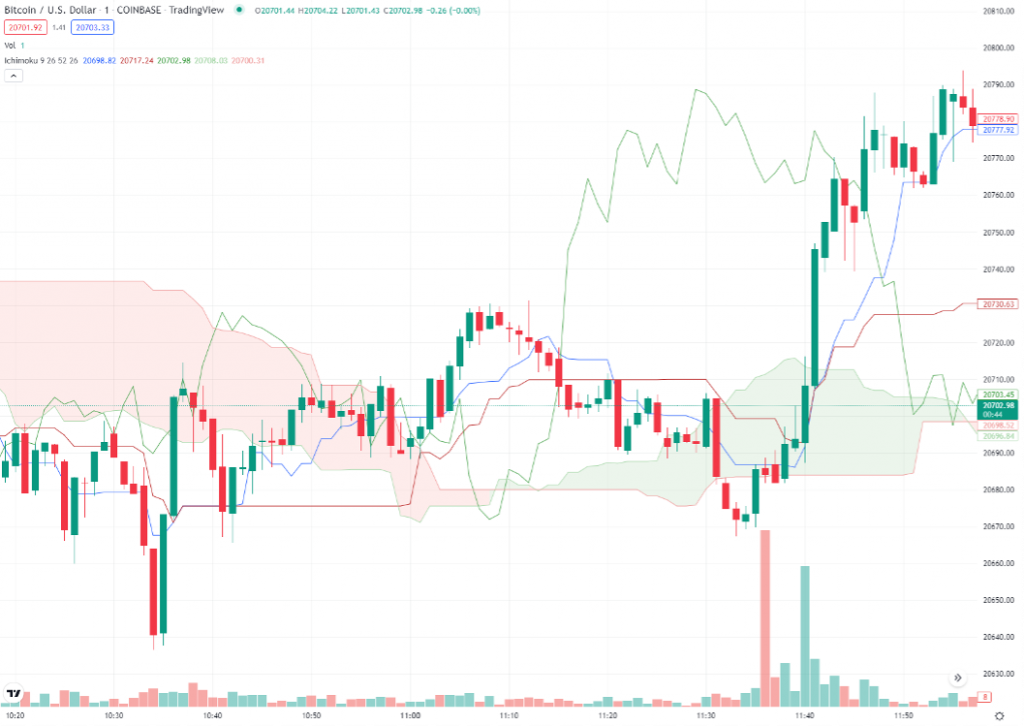
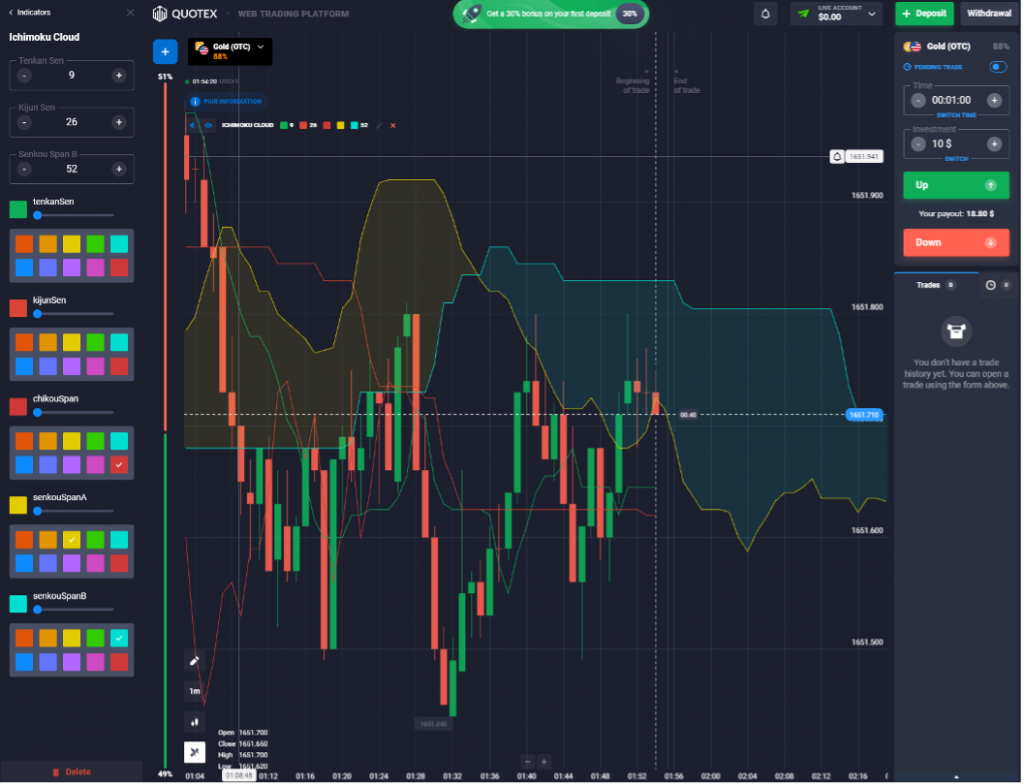
- The Blue line on the graph above is known as the Tenken-Sen, or conversion line. The conversion line is a nine-period average line derived from this time frame’s high and low values. The Tenken-Sen forms a minor support and resistance line and shows a general market trend.
- The Green line is known as the Chiku Span or lagging span. This line follows the close price, shifted back 26 time periods. It can be used as a support and resistance line or as a price signal when crossing the real-time asset price.
- The Red line is the Kijun-sen, or baseline. This value is derived from the highest and lowest values across a 26-candle time frame. Combined with the Tenkan-sen, this line acts as a price signal.
The Ichimoku Cloud, shown as a shaded area, is made up of three elements:
- The Green line at the boundary of the shaded area is the Senkou Span A. This value is calculated from the average of the Tenken-Sen and Kijun-Sen.
- The Red line at the boundary of the shaded area is the Senkou Span B. This value is calculated from the average of the 52 time period low and high prices.
- The Shaded area can either be red or green. A green shaded area indicates that there is a general uptrend in price. A red-shaded area signals a general downtrend.
The way that an asset price and indicator lines and areas interact with each other can be interpreted in several ways as part of a binary options Ichimoku strategy. We will cover some of these in our examples and strategies section later in this review.
Using The Ichimoku Strategy To Trade Binary Options
The utility of the Ichimoku means that there are plenty of use cases for trading binary options. In addition to providing buy and sell signals for standard binaries, the Ichimoku strategy also extends to boundary and touch variants through its provision of support and resistance lines.
However, the complexity of this indicator contrasts with the simplicity of binary options trading. For many investors who choose this instrument due to its straightforward nature, a binary options Ichimoku strategy may be unnecessary or overwhelmingly complex, particularly for beginners.
Examples
We’ve provided three examples of binary options Ichimoku analysis and trading strategies at work to help you understand the capabilities of this indicator.
Trader A is a forex specialist and has an eye on the GBP/CAD pair. They turn to the Ichimoku to predict the asset’s short-term price movement.
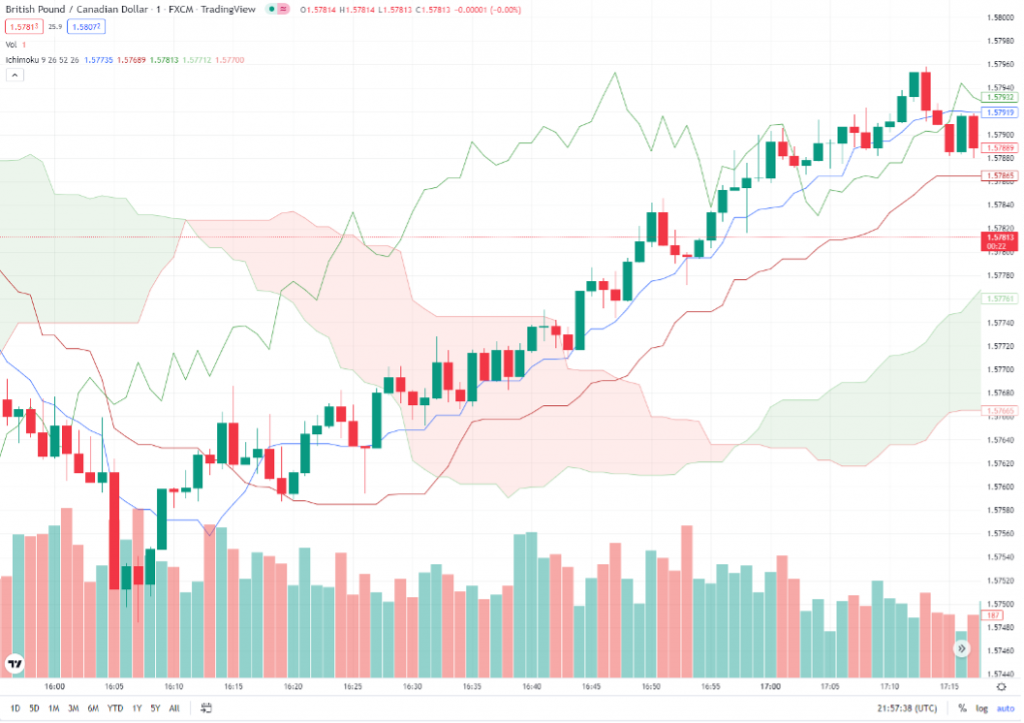
Trader A notices that at 16:58, the Senkou Span A and Senkou Span B cross over, transitioning from a red to green shaded area. Along with a rising Tenkan-sen and Kijun-sen, this crossover indicates a strong signal to go long on the asset.
As a result, Trader A opens a long binary options contract on GBP/CAD when the value is at 1.57860, using a short-term, five-minute contract length for this strategy.
Trader B is a crypto trader who wants to make some money on Terra 2.0 following the 2022 price collapse. They are interested in the binary options Ichimoku strategy and the indicator’s ability to display an asset’s support and resistance levels.
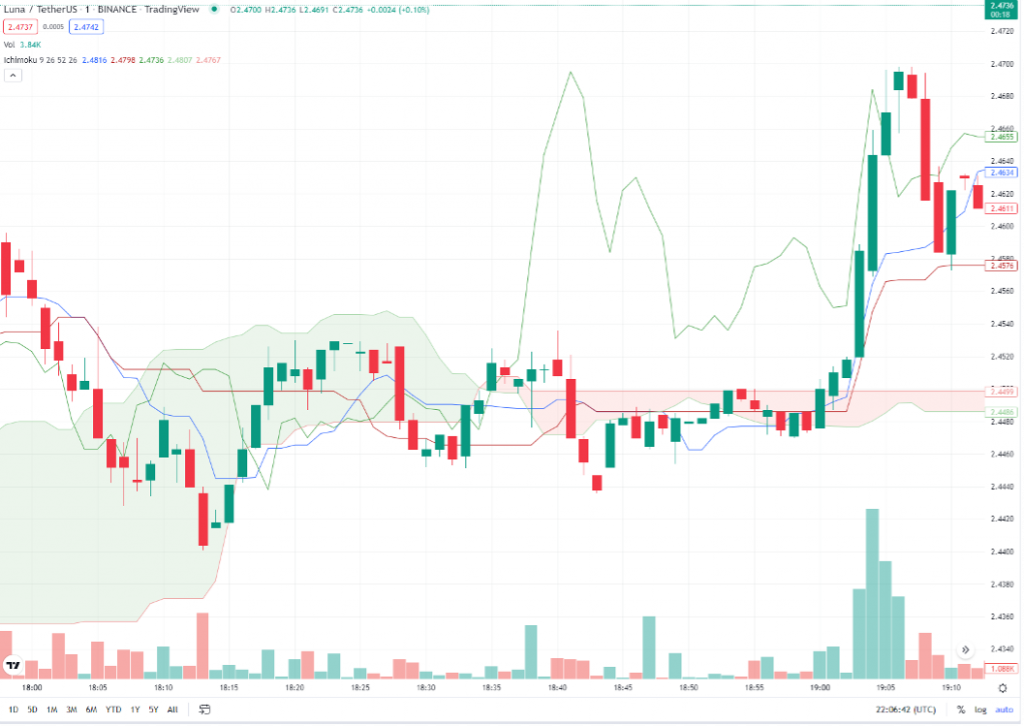
Trader B sees the price of LUNA spike up to 2.4660 at 19:04. However, they believe that the Chiku span shows resistance at around 2.4680 due to the corroboration of the current value with the earlier spike at 18:41.
As a result, they open a short position on LUNA at 2.4645 using a short-term binary options strategy of a five-minute contract.
Trader C is also a cryptocurrency enthusiast but wishes to speculate on Ripple (XRP) instead. They are interested in the capacity of the Ichimoku cloud to make longer-term price predictions.
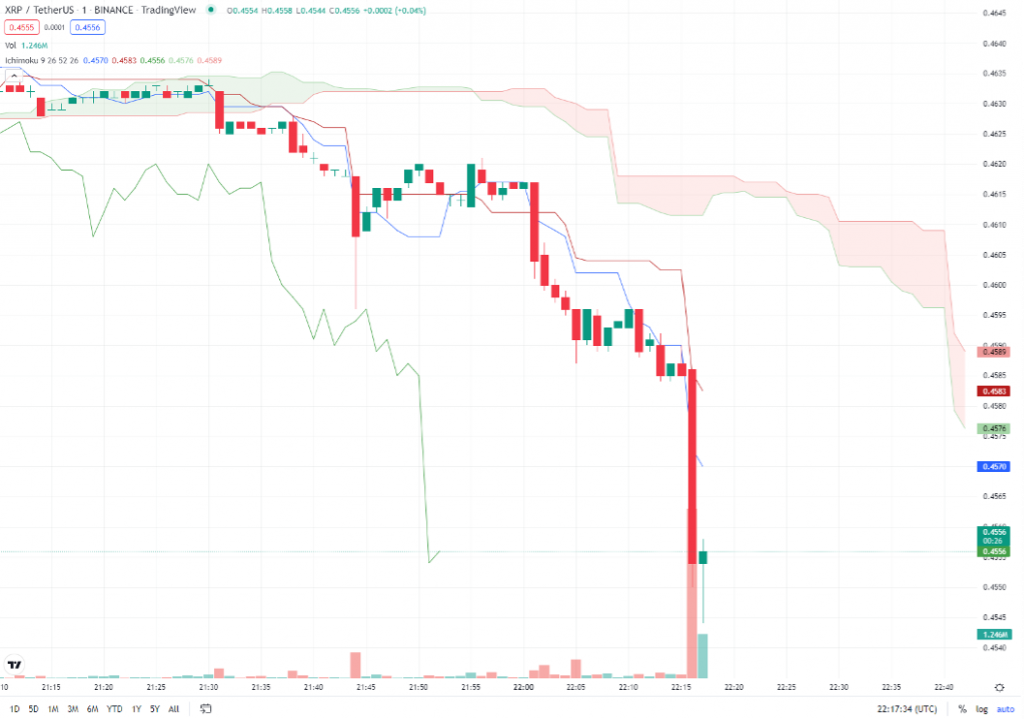
After the significant drop in price at 22:16, Trader C is still determining if the value of XRP will continue to fall or will rebound. They use the future signal of the Ichimoku cloud, shown by the red-shaded area, to predict a further drop. With the price at 0.4555, they open a short position on XRP with a 10-minute binary options contract.
Availability
Despite the complexity of the binary options Ichimoku strategy, many binary options brokers’ proprietary web platforms support the indicator. Indeed, even with simple platforms, experienced investors can tweak their approach and modify the values used to plot the various trend lines on the graph.
In addition to the lite platforms, third-party solutions such as MT4 and NinjaTrader 8 also support the Ichimoku indicator in their stock form. This means there is no need to download this indicator from the marketplace.
As a result, traders can use it to analyze forex, stock and commodity binary options on any platform.
Advantages Of The Binary Options Ichimoku Strategy
- Detailed indicator – The Ichimoku indicator provides trend lines, support and resistance and future price predictions, all in one tool.
- Strategy potential – Investors can use the information displayed by the indicator in the development of multiple binary options strategies, from 1-minute contracts to binaries that span 30 days.
- Pairs well – When combined with further tools such as the Relative Strength Index (RSI) tool, the Ichimoku indicator can create a comprehensive view of an asset’s value.
- Well-supported – Despite its complexity, the popularity of the Ichimoku indicator means that moist binary options platforms support it as standard.
Disadvantages Of The Binary Options Ichimoku Strategy
- Complex – The Ichimoku can be difficult to interpret. The signals may require deep study or trading book research to fully comprehend the lines’ interactions.
- Busy screen – Using the Ichimoku overlay makes a trading screen look busy and disorganised. This can be overwhelming to inexperienced traders or can obscure price data over 48 hours and beyond.
- Unreliable signals – The Ichimoku cloud is known for giving unreliable or weak signals. There is no guarantee of zero losses. With an all-or-nothing instrument such as binary options, this is not ideal.
Binary Options Ichimoku Strategies
To help you form an Ichimoku cloud binary options strategy, our experts have put together some suggestions for how to trade using this indicator. Of course, there is no best strategy: we suggest traders experiment with different signals in a binary options demo account before staking real funds.
Trend Trading
The most basic Ichimoku cloud binary options strategy is trading a trend. Investors can identify a movement by the alignment of the Tenken-sen, Kijun-sen and a corresponding red or green-shaded cloud.
One of these factors gives a weak signal, while all three moving in the same direction is considered a strong signal. This strategy works best with short to medium-term contracts, with a one, two, five or 30-minute binary options strategy well-suited to trend trading.
Reversal
Ichimoku indicators are also good at giving trend reversal signals. Investors should be on alert for a reversal when the price candlestick is within an Ichimoku cloud, as well as when the cloud lines converge and the shaded area changes colour.
Reversals can take time to occur but can also be subject to volatility. This means that a short binary options contract length, such as five minutes, is best suited to this strategy.
Long-Term Trends
One of the binary options advanced strategies possible with the Ichimoku indicator is predicting long-term trends. This is because, unlike many other indicators, the Ichimoku cloud extends far past the current price candlestick.
With the Ichimoku cloud’s predictive capabilities, traders can open short to medium-binary options contracts. For example, a five-minute strategy up to a 30-minute contract is within the range of an Ichimoku cloud.
Support & Resistance
Whether going long or short using standard binary options or variants like boundary and touch binary options, trading using support and resistance levels can enhance trading opportunities.
The Ichimoku cloud overlay can show support and resistance levels for an asset and allow investors to open medium to long-term contracts on an asset using various systems.
How To Set Up The Binary Options Ichimoku Strategy
Our experts have put together a tutorial to guide you through setting up the Ichimoku indicator for use in trading binary options:
Broker Sign-in
First up, sign into your binary options account. Due to the complexity of Ichimoku strategies, we suggest signing in to a demo account and learning the efficacy of different signals before staking real money. This will allow you to find the binary options Ichimoku strategy with the highest win rate for your preferred trading assets.
Adding The Overlay
Once you have signed in, it is time to add the indicator to your preferred trading asset chart. First, find the indicator group tab on your broker’s platform and then select “Ichimoku” or “Ichimoku cloud”.
Note, the top binary options brokers also offer tutorial videos and PDF guides on using their indicators.
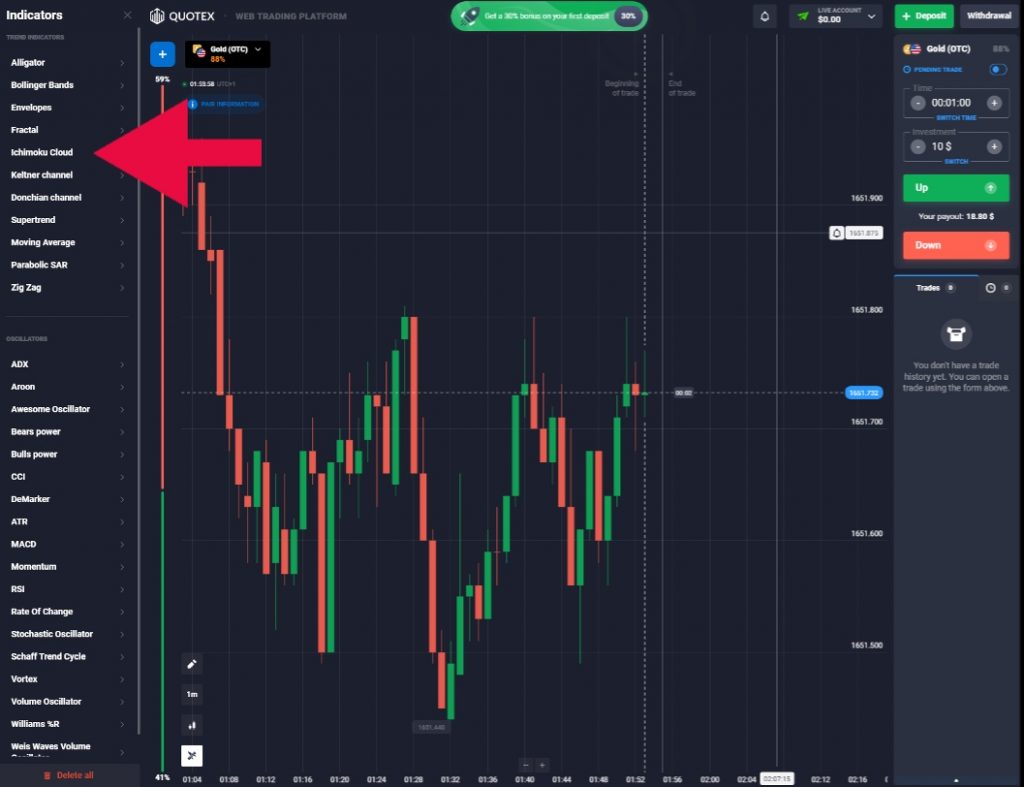
At this point, most platforms allow you to edit the values and colours used in the Ichimoku indicator. Set up the indicator to your personal preferences. But note you may only want to change the values used to plot the graphs if you have a thorough knowledge of trading and the specific indicator.
Monitor The Markets
With the Ichimoku indicator, there is plenty of price action to pay attention to. Signals are generated by price candles overlapping with the cloud, the price candle moving in the same direction as several lines and many other means.
Place A Trade
Once you have spotted a trading opportunity, use the binary options platform to place a trade. The optimal time period for a binary options Ichimoku strategy is often short to medium-length contracts such as a five-minute contract.
Final Word On The Binary Options Ichimoku Strategy
When trading binary options, Ichimoku indicators and strategies can help make predictions about financial markets. In summary, the indicator can provide valuable signals, such as support and resistance lines, price trends and long-term forecasts. When combined with other tools, such as the RSI indicator or Heiken Ashi candles, the Ichimoku cloud can make for a formidable charting tool. However, weak signals and a busy graph are notable downsides of this strategy.
FAQs
Is The Binary Options Ichimoku Strategy Good For Day Trading?
The Ichimoku indicator enables investors to use several day trading strategies when speculating with binary options. Use our guide to creating a binary options Ichimoku strategy to get started.
What Does The Binary Options Ichimoku Indicator Not Show?
Two trading factors not shown by the binary options Ichimoku indicator are volume and volatility. To combat this, the indicator can be combined with other tools, such as the RSI indicator.
Is Ichimoku A Winning Binary Options Strategy?
The signals and data drawn from the Ichimoku indicator can underpin a successful trading strategy, however, no strategy will work all of the time. Our tutorial explains the pros and cons of the binary options Ichimoku strategy.
Can The Ichimoku Indicator Generate Forex Binary Options Signals?
The Ichimoku cloud can generate signals that can be used across all binary options markets, including forex, cryptos, stocks and commodities.
Where Was The Binary Options Ichimoku Strategy Created?
The Ichimoku strategy was created in Japan during the 1930s by journalist Goichi Hosoda. It is formed using temporal averages instead of opening and closing prices. The result is a binary options indicator with less volatility than standard moving average indicators.


