Portfolio Construction: 4 Ways to Reduce Risk

Portfolio construction and the concept of building a better portfolio beyond the way assets come pre-packaged to you is one of the most under-talked about areas in finance.
As we write this to close out 2020, stock market indices in the US and many throughout the world are hitting new all-time highs. Traders are keen to get long risk and increasingly become long risk.
When the 2008 financial crisis hit, many traders were wiped out. They lost client money; they lost their own money; they had to liquidate at the time when you don’t want to sell (when assets are becoming cheaper). The same was also true during the 2020 Covid-19 crisis.
The natural question became – how can portfolio construction be done better to protect from the next crisis?
In the decade-plus since, we’ve become accustomed to stock markets that have gone up 15-16 percent per year with few drawdowns, with a major – but fleeting – hiccup associated with the Covid-19 downturn.
The bias to take risk
Most traders are biased toward their own domestic stock markets.
They are familiar with the companies. It’s the financial market that’s far and away most covered by the mainstream media.It’s the most easily accessible through their brokerage services. And it’s also the highest yielding asset class (at least at face value).
Combined with the fact that many traders and investors are constrained in how much leverage they can take on, the traditional way that portfolios are constructed is by putting most or all of their money in equities.
If we plot out asset classes on a graph in terms of their risk/volatility versus their reward, they will look something like what we see below. If we consider only assets’ returns and risks as they pre-packaged to us, the bias will be to concentrate our assets toward buckets in the upper right.
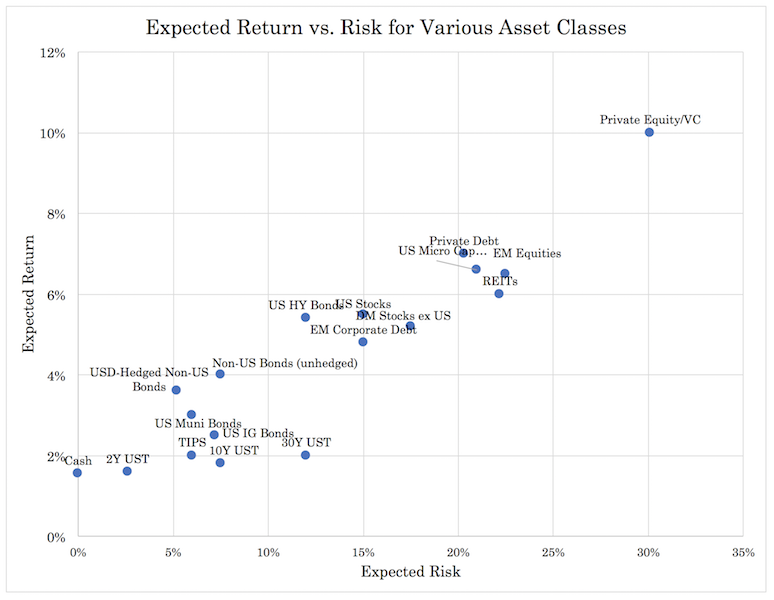
There are also certain approaches such as the 60/40 or 50/50 portfolio, where investors put 50-60 percent of their money in equities and the rest in mostly bonds.
The issue with these approaches is that stocks are 2x to 3x more volatile than bonds, so 85-90 percent of the risk in the portfolio is still concentrated in stocks and thus poorly diversified.
Moreover, because bonds are lower returning assets than equities, this approach hurts long-run returns.
If stocks return a bit less than 5.5 percent annually long-term and bonds of a relatively safe variety return 2.5 percent, the 60/40 and 50/50 portfolio would yield just 4.3 percent and 4 percent annualized, respectively.
Now with the liquidity pumped in to respond to the Covid-19 pandemic, stocks trade at some 25x-30x earnings, which puts forward returns at around 3-4 percent.
Bonds are close to zero, even negative in some cases, so the bonds portion of a portfolio no longer generates income and actually loses value through inflation.
A 60/40 portfolio might get you a percent or two in real returns going forward, if you’re lucky.
The drawdowns with a standard stock/bond mix wouldn’t be as bad as pure equities portfolios and would have slightly better risk-adjusted returns because of the diversification element that fixed income provides.
But the returns and risk concentrated in equities is still relatively high.
This is also the standard approach of pension funds who allocate to equities up to a level of risk they can tolerate, then allocate to other assets (mostly bonds) for the remainder.
But similar to the 60/40 and 50/50 approaches, these leave returns lower and risks disproportionately concentrated in equities.
Because of the current situation of high stock and bond market valuations, traders still need to be mindful of the risks they face. Higher asset prices mean more expensive asset prices and lower forward long-run returns.
Perhaps the biggest mistake in trading and investing is the perception that higher prices mean it’s a better investment rather a more expensive one. Likewise, lower prices mean something’s typically becoming a better investment rather than a worse one (save for the extreme circumstances, like uncovering fraud, formerly misrepresented financial situations, disclosure of previously non-public information, and so forth).
There are five main approaches that traders and investors can take to lower the risk in their portfolios and improve their return to risk ratios:
1. Options
The common way to cut off left-tail risk completely is by owning options. When you buy options (also commonly called being “long gamma”) you have a “limited downside, unlimited upside” type of structure. (Unless you buy puts, then your upside is limited by the underlying going to zero in price in some securities.)
The issue with options is that they tend to be expensive. They need to be to compensate the option seller for taking the risk of having a liability of unlimited downside.
Israelov (2017) took a more complete analysis by looking at a simple protective put option strategy (five percent OTM on the S&P 500). It found that the risk protection benefits provided are not compelling because of the “path dependency” associated with options.
This means that options have the big element of timing behind them. Over longer term time horizons, the theta (time) decay erodes their benefits.
We also discussed this as one of the negatives that go with buying options to protect a portfolio in this article.
And because forward expectations are already baked within a stock’s price, nothing should necessarily be viewed as a better or worse investment.
While it might seem obvious that a “new economy” company like Apple would seem like a better investment than a limited growth oil and gas company like ExxonMobil, the prices of each stock reflect forward expectations in relation to their risk.
With options you almost always pay too much for the limited risk structure. As mentioned, this naturally has to be true to incentivize the seller of the option to make a deal in the first place.
The options seller effectively manages the risk of the position for you and acts as a type of insurance provider.
In the current bull market run, the reality that most hedge funds have badly underperformed the market should not be unexpected. If active investors are doing their job, they will purchase protection (or use some type of strategy) to protect investors’ capital. In a bull market, those buying put option protection are going to lose money on these most of the time and are more likely to underperform indices.
The Covid-19 pandemic enabled hedge funds as a whole to beat passive indexes, breathing some new life into the industry.
Since 1986, a US-based 60/40 portfolio hedge with a 5 percent out-of-the-money (OTM) put option would have performed at 7.0 percent per year versus 9.0 percent for those forgoing protection.
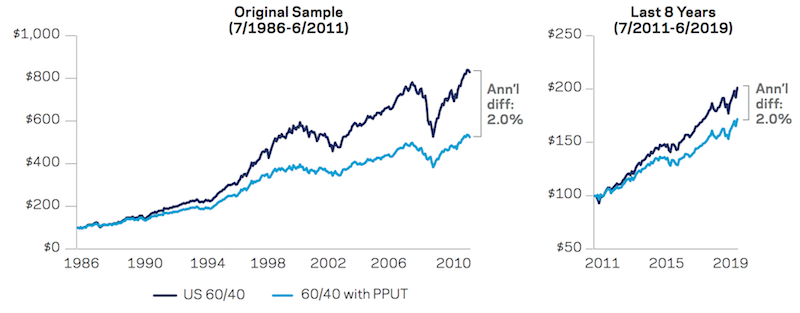
(Source: Source: AQR and CBOE. 60/40 portfolios represent 40% U.S. Bonds and 60% S&P 500 or 60% PPUT. PPUT is the CBOE’s put- protected index, which holds a long position indexed to the S&P 500 and buys monthly 5% out-of-the-money S&P 500 put options as a hedge.)
That two percent given up doesn’t seem like much. But over eight years, this is 17.2 percent in lost returns. Over 30 years, this would amount to 81.1 percent.
Of course, over 30 years you might expect to go through a few bear market cycles where buying protection would have preserved the value of your portfolio. However, you’d still lose money on net.
The argument could shift to the idea that a drop in average returns might be worthwhile if it meant lower drawdowns and would help traders remain invested when markets sour. The last thing you want to have to do is sell because you need cash.
However, even put protection on equities portfolios has neither helped mitigate losses nor reduced the length of underwater periods as much as traders might expect.
This is especially true for drawdowns that are more orderly and slower grinding. Options have a time component, meaning put protection will work best during sharp surgical drawdowns when implied volatilities spike, assuming they were purchased when the option premium was at a more reasonable valuation.
Nonetheless, these types of drawdowns are not characteristic of the drawdowns traders typically face with their portfolios.
The graphic below shows the five worst peak-to-trough drawdowns for US equities and put-protected US equities from July 1986 to June 2019.
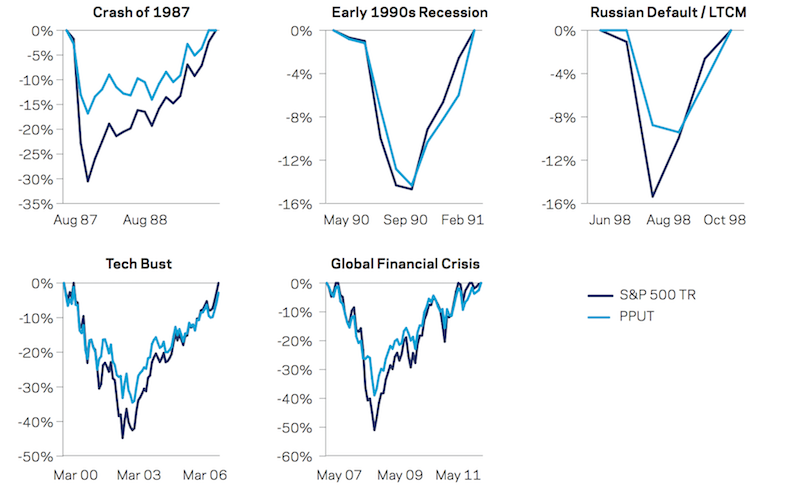
(Source: AQR and CBOE. PPUT is the CBOE’s put-protected index, which holds a long position indexed to the S&P 500 and buys monthly 5% out-of-the-money S&P 500 put options as a hedge.)
This shows that getting put protection to work for you heavily relies on a) timing and b) picking the right type of expiration.
It’s generally discouraged for the average trader to commit to this type of work because it’s very difficult to do well. Getting either part wrong will materially weaken the power of the option to effectively do its job in protecting the portfolio.
Accordingly, when market downturns do come around, and for most types of them, the actual capital preservation offered by the option is likely to be limited when considering the price paid for the option.
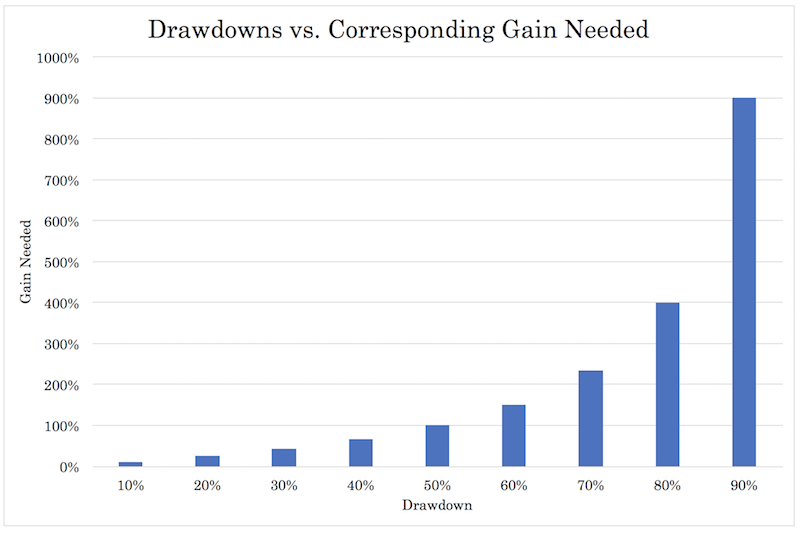
Downside risk should be avoided as much as possible, due to the disproportionate gain needed just to get back. If you draw down 50 percent, you need a 100 percent return just to get back to breakeven.
Nonetheless, you need to take some risk in order to achieve a reasonable return in the markets. Hedging this out through options can cut into an asset’s returns.
Accordingly, being appropriately risk conscious may necessitate reducing allocation to risk assets or better balancing the portfolio rather than resorting to buying options.
What about buying options in more tranquil markets?
When implied volatilities are low, put protection typically cheapens. Therefore, the question becomes, is it better to actively search for put protection when markets are calmer?
While this seems to be straightforward logic that buying options might make better sense in this type of environment, the drop in price is also a reflection of expectations of its lower fundamental value.
When options fall in price, they do so because they are less valuable to own in a less turbulent market.
2. Risk Parity
Risk parity is the concept of getting all asset classes to yield the same risk through leverage or leverage-like techniques. When different assets yield the same risk, you can diversify for all economic environments without having to sacrifice returns.
Achieve strategic diversification over the economic cycle is done by achieving balance among asset classes whose fundamental behaviors are best suited and least suited to different parts of that cycle.
There are generally four main sub-portfolios, based on falling or rising growth and falling or rising inflation. Different assets are better suited to each part of the cycle.
- In a rising growth environment, this is good for equities, credit, emerging market debt, and commodities.
- In a falling growth environment, nominal and inflation-linked bonds from sovereign governments do best.
- In a rising inflation world, inflation-linked bonds, commodities, and emerging market debt typically outperform.
- In a falling inflation world, nominal-rate bonds and equities tend to do well.
We often see the 60/40 and 50/50 portfolios labeled as “balanced”.
But from a risk point of view, equities dominate their price movements because of their higher volatility. Therefore, it’s not a particular well-balanced allocation and also stunts long-run returns due to the lower returns of the fixed income portion.
Risk parity works to increase the number of return sources and balances them more equitably in the allocation such that the portfolio isn’t dominated by any given asset or asset class.
Risk parity entails a host of different strategies that mean different things to different asset managers.
But getting an efficient diversification from several different asset classes in a relatively equal way – such that you can diversify for all economic environments without giving up expected returns – is at the core of the strategy.
In other words, unlike in the 60/40 and 50/50 portfolios, where your search for diversification is constrained by the fear of its impact on your long-run returns, risk parity designs the portfolio to remove this constraint.
Over the past eight years, stocks and bonds have done well to the point where diversification hasn’t helped investors much.
The “all stocks”, “all bonds”, and 60/40 portfolios have all done admirably despite the concentration in their risks.
Moreover, the hard asset classes typically included in risk parity portfolios have yielded negatively over recent history, and the value inherent in diversification can be reduced when the assets being included simply don’t perform well.
As a consequence, risk parity’s record over the July 1, 2011 to June 30, 2019 period is only comparable to that of the standard allocation approaches. It, however, achieved this performance with a lower equity beta (i.e., lower correlation to the stock market).

(Source: AQR. Global Stocks is the MSCI World, Global Bonds is the Barclays Global Aggregate, and Commodities is the GSCI. The Simple Risk Parity strategy targets equal volatility targets across these three asset classes. Volatility estimates are calculated using rolling 12-month annualized standard deviation.)
But the recent past isn’t always representative of the future, particularly when it’s been characterized by a strong bull market and there have been few instances over the period where unbalanced portfolios have been put through the wringer to see how they hold up.
In the 1970s, both stocks and bonds performed in a sub-average way, especially when consider their real (i.e., inflation-adjusted) returns, as commodities took off.
Commodities tend to do well in parts of the cycle when inflation is above expectations (sometimes higher commodities prices are a material part of the reason).
The point behind risk parity is that at any given point in time you don’t know which asset class is going to be a good investment, especially in terms of the risk-adjusted returns (e.g., will being overweight stocks be a good idea relative to their higher risk?).
Are stocks a good investment? Are bonds a good choice? Is gold? Are commodities?
One thing you can be pretty sure of is that each asset class is going to perform differently. Moreover, you can be pretty sure that financial assets are going to outperform cash if you give them enough time.
Free market economies don’t work very well if cash outperforms credit and equities over a long enough period of time. People with good ideas will always have good uses for cash and create a return from it.
Thus, if you allocate well to these asset classes and get the mix right, you can reduce your risk, and can reduce risk by more than your expected return (i.e., improve your reward to risk ratio).
There will be periods where portfolios concentrated in one or two asset class do well relative to a balanced allocation, but over the long-run a well-diversified portfolio will provide risk-adjusted returns better than a concentrated portfolio (e.g., equity-like returns with 30-40 percent of the risk).
Even despite the holding in commodities, risk parity kept up very well with stocks, bonds, and the 60/40 portfolio during this bull run.
During periods of lower growth and higher inflation, a truly well-diversified portfolio is likely to perform better than those with allocations in financial assets only.
How to construct a risk parity portfolio?
Each trader will construct it differently. But often, in order to get the fixed income proportion to exhibit the same risk as the equities side they will leverage the bond portfolio. How do they do this? Usually through the repo market or through bond futures (e.g., Treasury or bund futures). Repo is for large institutional clients while anyone can use bond futures.
One representative type of exposure will be:
– 20% stocks (developed market and emerging market across different sectors)
– 20% cash/short-term government bonds
– 15% intermediate-term government bonds (nominal and inflation-linked)
– 15% long-term government bonds (weighted toward the inflation-linked variety)
– 5% emerging market debt
– 10% corporate credit
– 5% commodities
– 10% gold
Aren’t bonds bad to have when they yield close to nothing?
It can make sense to lower one’s allocation to bonds when they yield less in relation to a different asset class (commonly called the “risk premium”).
But different asset classes act differently and do well in a particular environment. Even if their yield is low, they provide diversification benefits.
Almost everybody would agree that gold is not the best long-term investment and it has a very low long-term yield. But its inclusion in a risk parity portfolio (in a small allocation) is often done for its diversification properties.
Low yields by themselves aren’t enough to dismiss the usefulness of risk parity as a part of one’s portfolio.
Indeed, nominal rate bonds have traditionally been a material part of the balanced portfolio allocation. Sometimes the balanced beta concept even becomes misinterpreted as puting a lot of bonds in a portfolio.
Nonetheless, it’s important to understand that a balanced approach to designing a portfolio is not dependent on any particular asset class or about any particular static allocation.
The overall goal remains the same: to efficiently extract risk premium from the market without having a bias toward higher or lower growth or inflation.
But the way you construct a portfolio to achieve this goal may change over time.
The risks and returns of different asset classes, currencies, and countries and geographies will change over time.
Simplified portfolio approaches that work to do the basics well will also get most of the benefits.
But it’s not important to have allocations toward any particular asset class in any particular way.
With the present economic circumstances we’ve mentioned in other articles that are likely to last for a long time, such as very low rates of forward returns on cash and bonds, nominal rate bonds are no longer as big a part of the risk parity allocation.
Given most market participants are already biased to hold a lot of equities, balance traditionally involves diversifying the equities part.
That often means traditional nominal rate bonds can be a material part of the allocation, but it can be other things as well, especially in a world where bond yields are approximately zero in all the main reserve currencies and negative in real terms.
Protection toward all that risk is more likely going to come from other assets and different asset classes.
This can include assets like gold, inflation-protected bonds and variable rate fixed income, assets in different geographies and currencies, and certain types of stocks. Outside of liquid markets, this can include real assets and private assets.
Nominal rate bonds will still remain a part of the balanced portfolio approach. They are useful if deflation wins out.
They can still be especially valuable in the parts of the world where nominal yields are still positive and normal.
When nominal rate bonds have positive yields in countries and currencies you might want to have some exposure to, that can make perfectly good sense. Many Eastern countries (e.g., China, India) have a normal short-term interest rate (cash), positive bonds yields, and a regular upward-sloping yield curve.
Investors tend to get fixated on an approach that strongly biases them toward their domestic markets. It’s a natural tendency to stick with what they have access to and know of.
For an American trader or investor, for instance, that typically means holding all (or close to all) of their portfolio in equities (usually all held long), all US-based companies, and all in US dollars.
That will work well in an environment that favorable to US equities. Since 2009, the US market has been the best globally so it’s been a good strategy. Extrapolation tendencies cause a bias of that continuing.
But the traditional ways of getting a floor under the market are out of gas. Short-term interest rates are about as low as they can go (in terms of being stimulative) and long-term interest rates also can’t get much lower.
That means fiscal and monetary policy will have to unify (what some might call MMT). But that’s a political process and less reliable.
The basic idea is that the all-stocks portfolio will well in some environments and have terrible losses in others where the discounted environment (growth being lower than expectation) is inhospitable to good returns for equities.
This goes for all asset classes, no matter what it is. Bonds, gold, oil, and so on will all do well in certain environments and terribly in others. And knowing when these expectations will shift is not easy, even for the most sophisticated institutions.
Such concentrated approaches are heavily skewed toward a particular type of environment.
But the reality is that capital and wealth mostly shifts around. When stocks go down, most of that capital is just shifting somewhere else, not being destroyed.
For example, when stocks decline, the money that seemingly “disappeared” wasn’t actually wiped out (at least not anywhere near the majority of it).
It simply shifted into other asset classes, other currencies, other countries and geographies, and different stores of wealth.
US stocks are just a small part of the available universe of investments. All assets compete with each other for the world’s capital.
As part of a balanced allocation, nominal rate bonds will be less of a portion given where the yields on them are in all the main reserve currencies.
They will still be there, but more will be in the nominal rate bonds of other countries where yields are positive, with the rest being shifted into other asset classes, such as inflation-linked bonds, gold, commodities, and store of wealth equities (i.e., consumer staples, tech, companies of strategic importance).
How can risk parity perform well in a rising yield environment?
Falling yields are a tailwind to financial assets. It decreases the rate at which future cash flows are discounted, raising their prices. This is true for stocks and bonds.
Rising rates, on the other hand, are a headwind to financial assets. Accordingly, rising yields could cause stock and bond prices to decline.
In the case of stocks and corporate credit, this would be true if the rise in future discounted growth is not enough to compensate for the future discounted rise in rates.
In these cases, such as the 1970s period when inflation ran high in the US and stocks and bonds saw mixed results, gold and commodities did particularly well and kicked in to help offset the mediocre performance in financial assets.
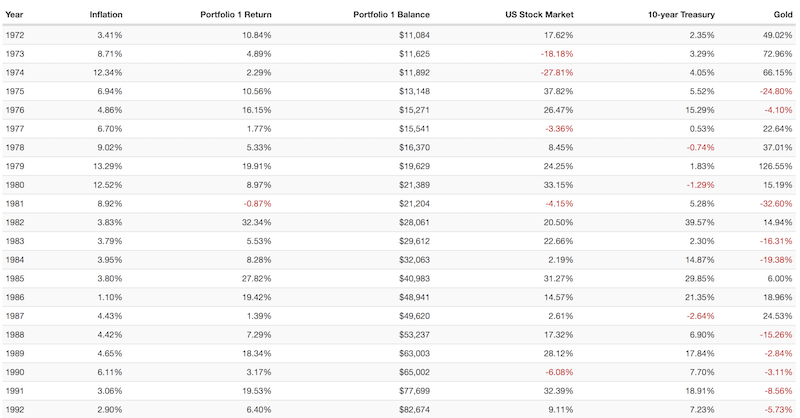
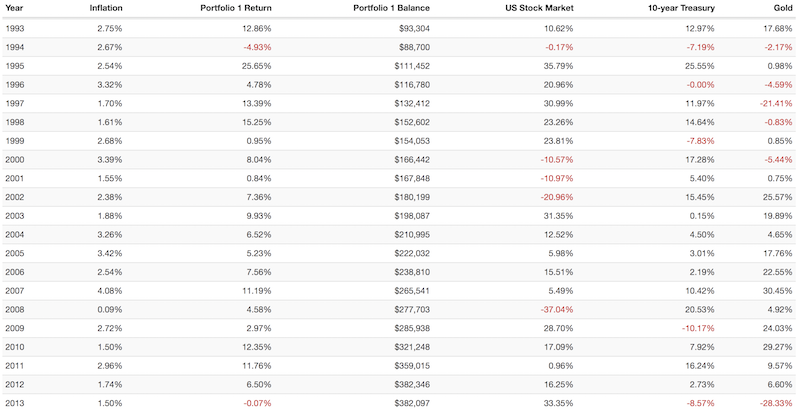
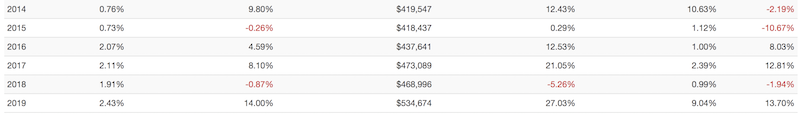
A three-asset portfolio comprised of 25 percent stocks, 65 percent 10-year US Treasuries, and 10 percent gold was a very good portfolio throughout the 1970s and 1980s, with only one mild down year in 1981 (lost only 87 basis points).
Since 1972, this portfolio has only had one real down year (down close to 5 percent in 1994) and four “breakeven” years where the loss was less than 1 percent. It made money in 2008 when US stocks finished the year down 37 percent.
On the other hand, if you only held stocks during this time, you would have had 10 down years (excluding the breakeven-ish year in 1994, when US equities were down very slightly).
In 10-year US Treasuries, you would have had six down years (excluding the more or less breakeven year in 1978).
If you are a gold bug and like putting your money into gold, you would have had 18 down years (excluding the small loss in 1998).
This is natural as gold is only a (volatile) cash alternative. So while its valuation increases over time by about the rate of cash, it will have many years in which it loses money.
3. Managed Futures
The issue with most types of investment products is that they simply give people more of what they already have – long exposure to equities markets.
Even common FX strategies, such as carry, are heavily correlated to the global credit cycle and hence global equities markets.
What are managed futures?
Managed futures, also commonly referred to as the CTA (commodity trading advisor) model, are heavily geared toward trend following.
Managed futures are often lauded for their diversification properties as they tend to do well when stocks do poorly and have returns that are not well correlated to equities markets.
In an AQR study from 1985 to 2011, they found that the S&P 500 and trend following had quarterly results of 1.8% and 2.8%, respectively. (Trend following outperformed stocks.)
Since then, the returns have been 3.1% and 1.7%, respectively. (Trend following underperformed.) Correlation to the S&P 500 was slightly negative.
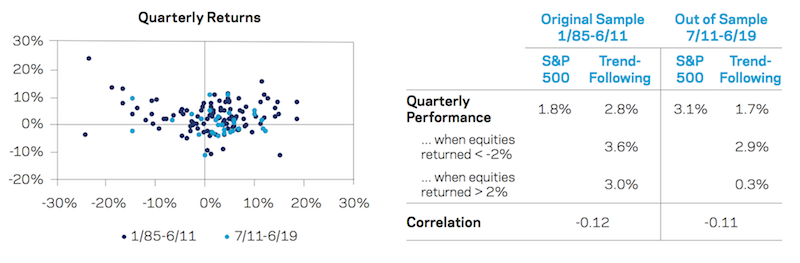
(Source: AQR)
With the weak performance of trend following, the natural question becomes whether it’s a fundamentally good long-term strategy that’s entered a weak period or simply a formerly good strategy.
Low volatility
Volatility in the markets over the second sample set (June 2011 to the present) has been low. If volatility is lower and moves aren’t as large, then trend following is likely to underperform.
More typical volatility in markets may be likely to lead to improved performance expectations.
New Research
This paper tests the trend following strategy over many decades to increase the ability to make more reasonable conclusions on the efficacy of trend following.
A 2019 paper examines how the CTA model works over 156 assets, including 16 long/short equity factors (e.g., momentum, quality, size, value).
A 2017 paper on macro momentum covers the concept of using fundamentals to go long fundamentally good or improving assets and short fundamentally bad or deteriorating assets. While CTA models are heavily price-based strategies, like risk parity, there is no standard approach and practitioners can vary greatly in the inputs they use and the implementation.
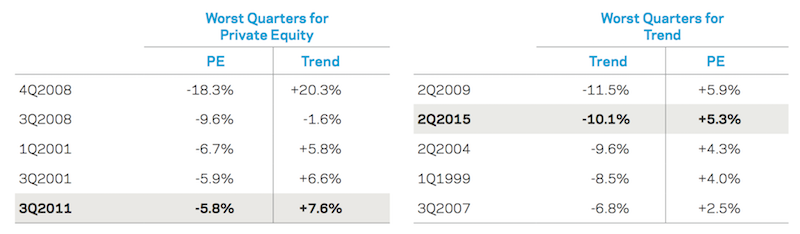
Even alternative asset managers like private equity are turning to managed futures to help diversify their portfolios.
AQR and Cambridge Associates note that the bad quarters for private equity can be smoothed out through exposure to CTAs.
Because private equity is exceptionally exposed to equity beta and this exposure is leveraged due to the nature of the transactions by which they take companies private, this can place great stress on the business model if there’s a deterioration in the business cycle.
This provides the need for new strategies to help mitigate these down-troughs.
4. Dividend and defensive stocks
Dividend stocks and so-called defensive stocks (e.g., utilities, consumer staples, low P/E stocks with positive cash flows) are common among investors who want the upside of equities but want some semblance of safety as well.
Dividend stocks are often prized by investors given that the dividend implies that a certain level of earnings are effectively “guaranteed” quarter to quarter.
In reality, this is not how it works and companies’ earnings underperform the dividend all the time (which increases the odds of cutting the dividend if it’s unsustainable).
But companies rarely pay dividends if they don’t produce sufficient earnings to meet it and dividends imply that they will be recurring indefinitely.
When this is not true and companies cut their dividend, the stock is generally punished harshly in the market.
Defensive stocks are often commonly thought of as stocks with a relatively low US market correlation and low drawdowns relative to the market. (“The market” is typically taken as the S&P 500.)
These include consumer staples, utilities, and, to a lesser extent, healthcare.
The energy sector is less correlated to the overall market than average. But oil and gas companies normally use a lot of leverage and are tied heavily to energy commodity markets, making it more prone to large drawdowns.
During the Covid-19 drawdown, energy performed terribly (like banks) while consumer staples and tech did very well.
The data below run from January 1999 to December 2019:
Portfolio Assets
| Ticker | Name | CAGR | Stdev | Best Year | Worst Year | Max Drawdown | Sharpe | ||
|---|---|---|---|---|---|---|---|---|---|
| XLY | Cons Discr | 9.84% | 18.59% | 42.73% | -32.97% | -55.09% | 0.50 | ||
| XLP | Cons Stap | 6.58% | 12.22% | 27.43% | -20.10% | -32.61% | 0.44 | ||
| XLE | Energy | 4.45% | 24.57% | 40.17% | -38.97% | -63.91% | 0.23 | ||
| XLF | Financials | 3.78% | 21.64% | 35.52% | -54.97% | -78.68% | 0.20 | ||
| XLV | Health Care | 8.32% | 14.17% | 41.40% | -23.31% | -35.50% | 0.51 | ||
| XLI | Industrials | 7.94% | 18.85% | 40.55% | -38.74% | -57.16% | 0.41 | ||
| XLB | Materials | 7.90% | 21.20% | 48.18% | -44.05% | -55.49% | 0.38 | ||
| XLK | Tech | 7.50% | 23.25% | 65.14% | -41.88% | -80.47% | 0.35 | ||
| XLU | Utilities | 7.09% | 14.81% | 28.73% | -28.93% | -43.51% | 0.42 |
As can be seen from the max drawdown column, tech and financials were massively decimated due to the 2000 tech bubble and the subprime mortgage market in 2008, respectively.
Staples, utilities, healthcare, and dividend-paying stocks with stable cash flows tend to have less market sensitivity. They have historically delivered better risk-adjusted returns than higher-beta sectors like tech, financials, consumer discretionary, energy, materials, and industrials.
Below is also a correlation table among the different sectors. But note that correlations are unstable and fleeting byproducts of their intrinsic differences. It’s still nonetheless useful to see that stocks, no matter what their character, are still quite correlated.
Correlation Table: Equities by Sector
| Ticker | Name | XLY | XLP | XLE | XLF | XLV | XLI | XLB | XLK | XLV | |
|---|---|---|---|---|---|---|---|---|---|---|---|
| XLY | Consumer Discret Sel Sect SPDR ETF | 1.00 | 0.55 | 0.53 | 0.78 | 0.71 | 0.83 | 0.77 | 0.71 | 0.33 | |
| XLP | Consumer Staples Select Sector SPDR ETF | 0.55 | 1.00 | 0.41 | 0.57 | 0.55 | 0.57 | 0.48 | 0.34 | 0.54 | |
| XLE | Energy Select Sector SPDR ETF | 0.53 | 0.41 | 1.00 | 0.54 | 0.46 | 0.66 | 0.67 | 0.42 | 0.38 | |
| XLF | Financial Select Sector SPDR ETF | 0.78 | 0.57 | 0.54 | 1.00 | 0.64 | 0.81 | 0.72 | 0.54 | 0.36 | |
| XLV | Health Care Select Sector SPDR ETF | 0.71 | 0.55 | 0.46 | 0.64 | 1.00 | 0.70 | 0.64 | 0.62 | 0.38 | |
| XLI | Industrial Select Sector SPDR ETF | 0.83 | 0.57 | 0.66 | 0.81 | 0.70 | 1.00 | 0.85 | 0.67 | 0.41 | |
| XLB | Materials Select Sector SPDR ETF | 0.77 | 0.48 | 0.67 | 0.72 | 0.64 | 0.85 | 1.00 | 0.58 | 0.36 | |
| XLK | Technology Select Sector SPDR ETF | 0.71 | 0.34 | 0.42 | 0.54 | 0.62 | 0.67 | 0.58 | 1.00 | 0.21 | |
| XLU | Utilities Select Sector SPDR ETF | 0.33 | 0.54 | 0.38 | 0.36 | 0.38 | 0.41 | 0.36 | 0.21 | 1.00 |
Defensive equity performance
The graphs below show performance of equities based on their beta, organized by deciles. The time period is split like similar studies in this article based on AQR studies – data up to June 2011, and data from the eight-year period running from June 2011 to June 2019.
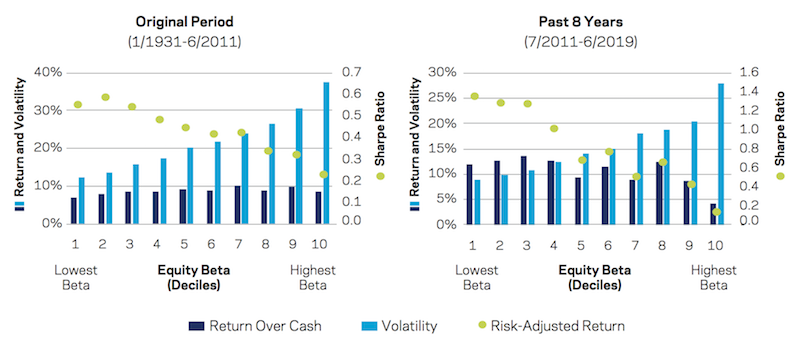
(Source: AQR)
The green dots show risk-adjusted return.
The 1931 to 2011 period shows superior risk-adjusted returns in the lowest beta equities. From 2011 to the present, this relationship has become even more pronounced with the lowest beta stocks outperforming their higher beta peers. The 2011-2019 period, of course, was also characterized by a relatively steady bull run.
New research favoring defensive investing
Because many types of investors, such as individuals, pension funds, and mutual funds, are constrained in how much leverage they can use, they focus their attention on risky assets.
This focuses a lot of attention on playing offense and little on protecting yourself, which comes with the aspect of periodically suffering horrendous drawdowns.
A 2011 paper looks at defensive investing among nearly 56,000 stocks and branches out into analyzing several equities markets, developed bond markets, currencies, commodities, and goes into the sub-asset level within US Treasuries (i.e., do shorter-duration Treasuries outperform longer-duration Treasuries on a risk-adjusted basis?).
This 2019 paper looks at “defensive investing’s” track record over time by exploring how it’s done over various asset classes and in different countries.
This paper addresses whether “low risk” is an increasingly crowded trade, thus pulling down forward long-run returns. The general conclusion of the paper is that trying to time allocations into anything is difficult and hard to use as a strategy to outperform market returns.
Conclusion
When traders and investors of all types think about diversifying or hedging, what they are often referring to is equity risk. The average hedge fund tends to have a beta to the US stock market of 0.75-0.90. This is too high for a product charging the types of fees that it does.
Giving clients exposure to a lot of what they already have – equity risk – is not a good way to serve the purpose of having a differentiated product.
The passive versus active debate is not that passive is taking over; people have simply stopped paying for beta. Anybody can go out and buy an ETF for virtually free or close to free that gives them equity exposure.
De-risking a portfolio and eliminating left tails is predominantly about reducing a trader’s equity beta. Buying options is one way to cut off left-tail risk. But it’s an expensive way of doing it.
Instead, traders are usually better off reducing the risk through diversification strategies and utilizing multiple return streams either independent of the equity markets or with less correlation to the equity markets.
60/40 and 50/50 portfolios help to reduce the allocation to equities.
But equities still disproportionately dominate the risk in these portfolios because of their higher volatility and thus tend to comprise 85-90 percent of the risk. It also lowers the expected returns because of the allocation to lower-yielding fixed income.
To combat this issue, some use risk parity, which works to leverage the fixed income part of the portfolio to get its risk in line with the equity exposure.
Risk parity, in general, uses multiple asset classes, makes them exhibit the same risk, and mixes the assets in a way such that it’s not biased toward any particular economic environment.
This helps bring comparable returns to the equity market at less risk, better returns with the same risk, or some permutation thereof.
Managed futures, or CTAs, are largely trend following systems. They are heavily computer-based and rule-driven.
They are typically long risk premia and add to their positions as they begin to move in their direction and cut positions as they move against them.
Because of this approach, the payoff profile of CTAs is similar to that of being long an option.
Buying defensive stocks still involve a lot of equity beta, but can help to improve risk-adjusted returns in comparison to buying higher-beta equities. Everybody wants to find the next Facebook or Google by buying growth stocks, but it’s hard to do.
With the reality that financial asset returns will be nothing like the past, with volatile sovereign bonds yielding anywhere from minus-100bps to +100bps and US equities likely to yield only 3-4 percent per year going forward, this makes considerations of strategic asset allocation and prudent portfolio construction more important than normal.
With lower-than-normal returns associated with the same (or higher) risk, having concentrated bets in stocks or bonds is not likely to be a very good portfolio going forward.
Learning ways to better diversify and thinking more strategically about portfolio construction to keep the upside while limiting downside will be important for traders and investors and their ability to perform well over the long-run.