Volatility Skew


Options are heavily priced off the expected volatility of the underlying asset. Options of the same maturity would normally be expected to have the same implied volatility irrespective of the strike price.
Nonetheless, in practice, the implied volatility can vary materially depending on the strike.
This is called the volatility skew.
Key Takeaways – Volatility Skew
- Volatility skew indicates higher implied volatility for out-of-the-money (OTM) options than at-the-money (ATM) options.
- Traders can monitor volatility skew to anticipate market sentiment and potential price movements.
- A steep volatility skew suggests increased demand for OTM options, indicating expectations of significant price shifts.
- Also shows the relative value of different options.
Understanding Implied Volatility
Implied volatility (IV) is a measure derived from an option’s market price, representing the market’s expectation of the underlying asset’s volatility over the option’s life.
Higher IV indicates greater expected volatility and vice versa.
IV is a critical component in option pricing models, such as the Black-Scholes model.
Types of Volatility Skew
There are generally two types of volatility skew:
Vertical Skew (Smile)
This occurs when IV varies with strike prices for options with the same expiration date, typically forming a U-shaped curve.
Horizontal Skew (Term Structure)
This occurs when IV varies with different expiration dates for options with the same strike price, reflecting how volatility expectations change over time.
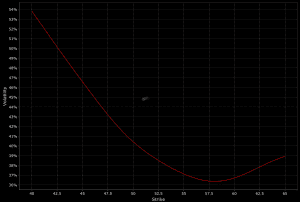
Volatility Smile
Volatility skew is found by plotting implied volatilities on the vertical axis and strike prices on the horizontal axis.
When there is more demand for options that are further in-the-money (ITM) or out-of-the-money (OTM), this will be reflected in higher implied volatility at the far left and far right of the curve. This is referred to as a “volatility smile” with the shape that it makes.
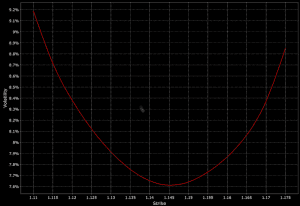
The symmetric distribution is common in currency/forex markets. This means that OTM options are typically bid up by traders betting on big moves in the currency. The above diagram shows euro futures against the US dollar.
Volatility Smirks
There are two types of “volatility smirks”: forward skew and reverse skew.
Forward Volatility Skew
For forward skews, the implied volatility at the higher strikes is greater than those at the lower strikes. This means that OTM calls and ITM puts would be in greater demand than OTM puts and ITM calls.
Forward options skew is common in some commodities markets.
For example, in agricultural products and natural gas, the weather is an important driver of the commodity’s price because it affects supply. Inclement weather, fires, frosts, droughts, and other natural disasters can materially disrupt production. Such events can be very influential on these markets, much more than a continuation of typical weather patterns, which are already baked into the price.
This means that businesses dependent on these commodities are likely to seek protection against these events by purchasing OTM calls as a hedge. This creates a forward skew, as can be seen in the natural gas market.
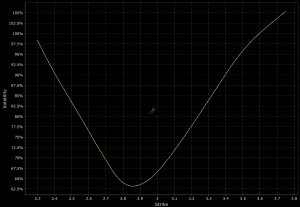
It is currently present in coffee as well:
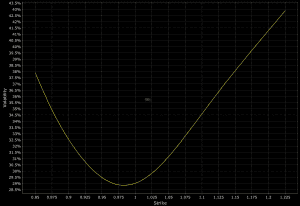
Reverse Volatility Skew
Reverse volatility skew is common in equity markets and in some commodities, such as oil.
Here is the E-mini S&P 500 futures reverse skew, which exhibits heavy reverse skew:
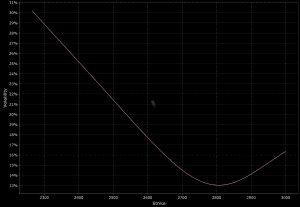
Below is the reverse skew in WTI crude oil:
Reverse skew shows that OTM puts and ITM calls are in greater demand than OTM calls and ITM puts.
In the case of equities, most traders are long this asset class. Equities are among the highest-returning investment classes, so most want to have long exposure to it.
At the same time, stocks are volatile and this increases the demand for OTM puts and ITM calls, which protect downside.
OTM puts act as a hedge on current stock holdings. ITM calls allow one to participate in the uptrend of a stock market while minimizing losses because the most you can lose is the premium paid for the option.
Additionally, ITM calls offer not only downside protection but offer embedded leverage. One can buy stocks without making a large capital outlay like they would when buying the underlying securities.
Causes of Volatility Skew
Volatility skew arises due to several factors, including:
Market Sentiment
Traders’ expectations of future price movements influence demand for different strike prices, affecting IV.
Sentiment essential means changes in flows and positioning based on factors outside traditional fundamentals.
Supply and Demand Imbalances
Disparities in buying and selling pressures at various strike prices create skewed IV patterns.
Hedging Activities
Institutional investors and market makers hedge their positions, impacting the IV of options with certain strike prices.
Trading Strategies Using Volatility Skew
Skew Arbitrage
Skew arbitrage involves exploiting discrepancies in implied volatility between options with different strike prices or expirations.
Traders buy undervalued options (low IV) and sell overvalued options (high IV).
This intends to profit from the eventual normalization of IV disparities.
Risk Reversals
A risk reversal strategy combines buying a call option and selling a put option with different strike prices but the same expiration date.
This strategy bets on changes in the volatility skew – i.e., anticipating a shift in market sentiment towards bullish or bearish trends.
Iron Condor
An iron condor strategy involves selling an out-of-the-money call and put, while simultaneously buying a further out-of-the-money call and put.
This neutral strategy profits from low volatility and stable skew, trying to capture premium decay while minimizing exposure to skew changes.
Key Considerations
Monitoring Market Conditions
Constantly monitoring market conditions is critical for volatility skew trading.
Factors like earnings reports, economic data releases, and geopolitical events can impact implied volatility and skew patterns.
Understanding Greeks
Proficiency in option Greeks – Delta, Gamma, Vega, Theta, and Rho – is essential for effective skew trading.
These metrics provide insights into how options’ prices and implied volatility will respond to changes in the underlying asset, time decay, and volatility shifts.
Risk Management
Strong risk management practices are vital in volatility skew trading.
Setting appropriate stop-loss levels, options to cut off left-tail risk, position sizing, and diversification are key to reducing potential losses arising from unexpected market movements or skew changes.
Let’s look at some trades involving volatility skew trading:
Example Trade: Skew Arbitrage Using Call Options
Identify Discrepancies in Implied Volatility
Analyze the implied volatility across different strike prices for call options on a specific underlying asset (e.g., SPY).
Assume you identify that the 300-strike call option has an IV of 20%, while the 320-strike call option has an IV of 25%.
Select Options for the Trade
Choose the 300-strike call option to buy and the 320-strike call option to sell.
Determine Position Size
Decide on the position size based on your risk tolerance and account size.
For this example, we’ll use 10 contracts.
Place the Trade
- Buy 10 contracts of the 300-strike call option at $5 per contract.
- Sell 10 contracts of the 320-strike call option at $3/contract.
Expected Outcome and Risk Management
Profit Potential:
- The trade profits if the IV of the 320-strike call decreases relative to the 300-strike call or if the overall volatility decreases, leading to convergence in their IVs.
Risk Management:
- Monitor the IV spread between the two options.
- Set a stop-loss to close the trade if the IV spread widens beyond a predetermined threshold (e.g., if the IV of the 320-strike call increases to 27%).
Example Trade: Risk Reversal Strategy
Identify Market Sentiment
Determine market sentiment and anticipate a directional move in the underlying asset (e.g., expect bullish movement in AAPL stock).
Select Strike Prices
- Choose a call option with a strike price above the current stock price (e.g., 150-strike call).
- Choose a put option with a strike price below the current stock price (e.g., 140-strike put).
Determine Position Size
Select a position size. For this, we’ll use 5 contracts.
Place the Trade
- Buy 5 contracts of the 150-strike call option at $4 per contract.
- Sell 5 contracts of the 140-strike put option at $3 per contract.
Expected Outcome and Risk Management
Profit Potential:
The trade profits if the underlying asset (AAPL) increases in value.
This leads to an increase in the value of the call option while the put option becomes worthless or decreases in value.
Risk Management:
Monitor the underlying asset’s price movement and set a stop-loss to close the trade if the asset price moves against your expectations (e.g., if AAPL drops below $138).
Example Trade: Iron Condor Strategy
Identify Stable Market Conditions
Determine that the underlying asset (e.g., QQQ) is expected to trade within a specific range over the option’s life.
Select Strike Prices
Choose out-of-the-money (OTM) call and put options:
- Sell the 310-strike call
- Buy the 320-strike call
- Sell the 270-strike put
- Buy the 260-strike put
Determine Position Size
Decide on the position size.
Here we’ll use 5 contracts.
Place the Trade
- Sell 5 contracts of the 310-strike call option at $3 per contract
- Buy 5 contracts of the 320-strike call option at $1.50 per contract
- Sell 5 contracts of the 270-strike put option at $2.50 per contract
- Buy 5 contracts of the 260-strike put option at $1 per contract
Expected Outcome and Risk Management
Profit Potential:
- The trade profits if the underlying asset (QQQ) remains within the range of 270 to 310, allowing you to capture the premium decay of the sold options.
Risk Management:
- Monitor the underlying asset’s price movement and set a stop-loss to close the trade if the asset price moves beyond the breakeven points (e.g., if QQQ exceeds 312 or drops below 268).
Conclusion
Volatility skew, also known as volatility smile or volatility surface, refers to the pattern where implied volatility differs across options with the same underlying asset but different strike prices and expiration dates.
This phenomenon reflects market sentiment and supply-demand imbalances for different strike prices